March 9, 2020

written by Net Advisor™
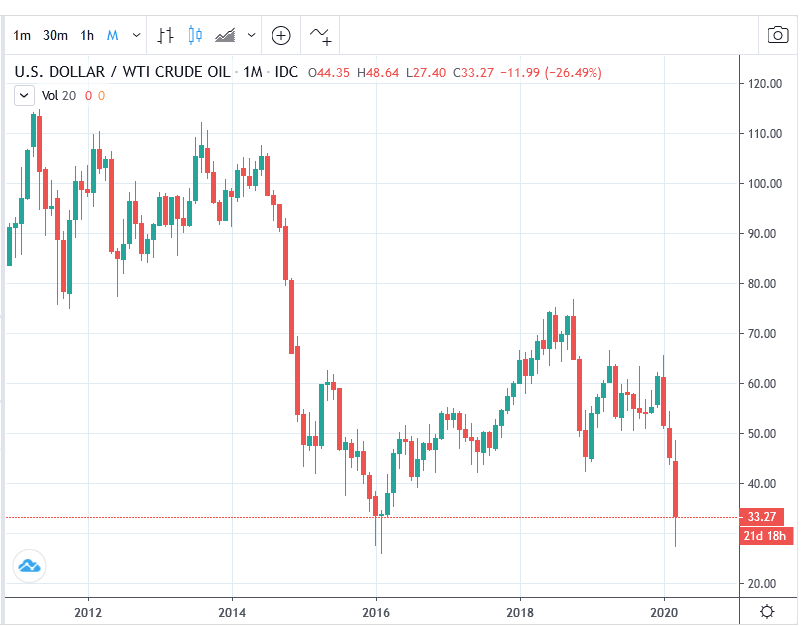
RIYADH, Saudi Arabia. Much of the politically-driven U.S. media are still in panic-mode with Covid-19 or the “Corona Virus.” Today, stocks fell sharply not so much over Covid-19, but more due to Saudi Arabia & Russia’s Oil Price War.
The Saudi and Russian price war is impacting global oil markets after Saudi Arabia and Russia could not come to an agreement on their oil production at the G-20 Summit in Riyadh, Saudi Arabia.
Russian Energy Minister Alexander Novak said oil production talks failed to come to terms between OPEC and Russia on March 6, 2020. OPEC wanted to cut oil output by 1.5 million barrels per day to keep prices higher amid global slowdown. Some speculate that Covid-19 may further slow global demand for oil. Russia balked at the proposed oil cuts. Now Saudi oil ministers say they will increase production, to drive prices lower to hurt Russia (which also hurts other oil producers such as the USA).
“Saudi Arabia said it would lower prices and increase production even as demand for oil has weakened.”
— Market Watch, March 9, 2020.
Oil and energy-related stocks crashed over 30 percent across-the-board. A technical crash is a 20 percent one-day price drop from the previous closing price. This unexpected Saudi move first shook international markets overnight with some major foreign indexes falling 7 to 11 percent in a single trading day. This plunge bled over to U.S. markets falling in kind with Europe on Monday, March 9, 2020.
Here is the Good News!
Low oil prices mean consumers will pay a lot less for gasoline. Truckers will pay less for diesel which influences the price of food and retail goods.
Retail oil prices don’t fall overnight. However, as soon as the local gas station needs to buy more fuel, they are purchasing it at far steeper prices. Competition helps keep prices down.
Would you rather see oil prices up 178% paying a record amount at the gas pump along with massive government regulations that cut American jobs?
Just Another Thing for Politically-driven Media to Panic Over.
The market has been in correction mode falling just over 17 percent this year, but still up over 50 percent since the 2016 election. The initial market correction was over Covid-19 where analysts have concern about corporate earnings.
Most of the U.S. economy is based on consumer purchases, and today a massive amount of items are purchased online. In fact, on-line sales were up 81 percent over the last four years to $3.43 Trillion.
The U.S. economy has been on a boom since the 2016 election with new policies that have driven unemployment to record lows, helping those with lower and middle-class incomes the most. Also since the 2016 election, the U.S. economy has outperformed the 7 largest economies in the world.
All of this wasn’t by accident, but rather by the changing of policies that allowed the U.S. economy to grow.
Yet the media is already talking recession. Actually many in the establishment and business media, including but not limited to (CNN) (the Atlantic) (Money) (Forbes) (Business Insider) and leftist economists (and this one) all have been wrong about where the economy was going since the 2016 election.
Media Who Don’t Understand Markets.
The politically-driven media likes to rationalize that the recent market correction is the worst or around the worst in history. This could not be further from the truth.
There seems to be a lack of understanding that percentage moves in stocks and markets are far more important than point moves.
The largest one-day percent gain for the Dow Jones Industrial Average (DJIA) occurred on March 15, 1933. The Dow climbed a massive +8.26 points or up +15.34% in a single day.
On the extreme downside, October 10, 1987, the DJIA technically crashed, falling a mind-blowing 508 points or down -22.61% in a single day.
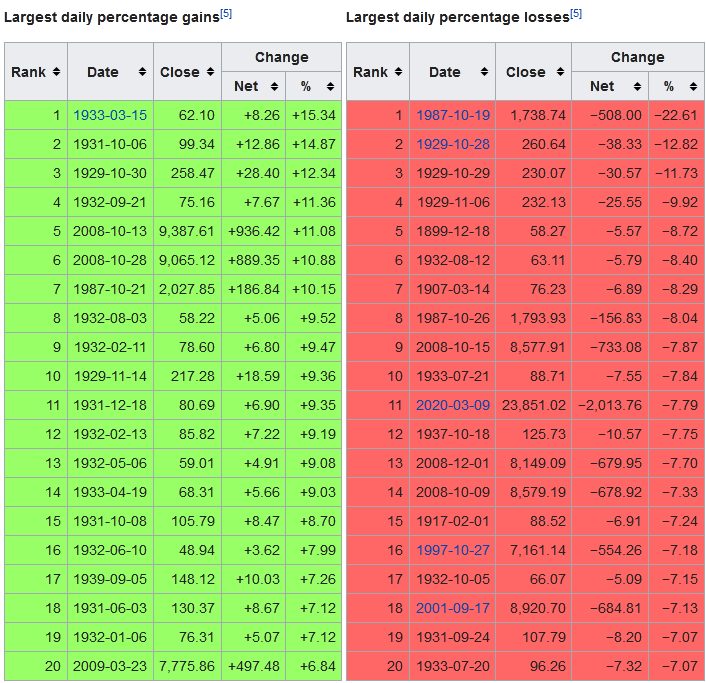
As U.S. stock indexes such as the DJIA hit the 20,000 to 30,000+ range, we will see larger point movements as the norm. However, it is the percentage movement that is more important to markets and investors.
If you have $1.00 and then you have another 20 cents, do you really care? On a percent basis, that 20 cent move is a gain of twenty percent. Something that most all fund managers never consistently obtain on an annual, let alone on a long-term historical basis.
So try and not get caught up with market movement “points” by media who don’t understand markets.
Our View.
We think stocks will be under some pressure until more certainty comes to the market. We would expect to see a periodic Dead-Cat Bounce after a sharp decline and selling into a big short-term rally. There is always a chance that something can happen. Economies move up, down and sideways. How they are managed can greatly influence growth or lack of growth in an economy.
Refinance Debt!
The U.S. Federal Reserve bank just cut rates by a half-point and may cut one or two more times by this and or next month. If you have debt, a mortgage, or car payment, check your interest rates. What a great time to reduce your payments by locking in fixed rates with these FED interest rate cuts. Talk to your lender or appropriate financial or tax advisor.
What to do with stocks?
More people prepare for panic and vacations than they do for retirement. For the long term (10+ years), we like the historical strategy that has worked well during volatile market times: Dollar Cost Averaging using major market indexes such as the S&P 500.
NetAdvisor™ is a former nine-time state, FINRA licensed, 401(k) and retirement planning specialist, experienced in hedge fund management, and a financial and risk management consultant. Read more bio.
Please keep in mind that views and opinions can change as information change, and such may be without notice. Disclaimer.
Graphics copyright by their respective owners.
Original article content, Copyright © 2020 NetAdvisor.org® All Rights Reserved.
NetAdvisor.org® is a non-profit organization providing public education and analysis primarily on the U.S. financial markets, personal finance and analysis with a transparent look into U.S. public policy. We also perform and report on financial investigations to help protect the public interest. Read More.
