February 29, 2020
Investor Education Series by Net Advisor™
A simple strategy on how to manage volatile markets over long periods of time such as planning for retirement.
MANHATTAN, New York. The media and financial markets are currently in panic mode (or creating panic mode) about Covid-19 or the “Corona Virus.” As of today, a whopping 2,462 people have been killed world-wide plus one person in the USA who had other serious health issues.
Brief History of Death and Diseases.
In the 1930’s the stock market and media concern was the Great Depression and World War I. Over 23 Million people were killed during the first World War. By the 1940’s the market and media was concerned about World War II, where nearly 70 Million people were killed. By the 1950’s, is was the Korean War followed by the Vietnam War, and so on.
We also had the most deadly virus in history: Influenza, today known as ‘the common cold.’ According to Standford University, The Flu killed between 20 and 40 million people during 1918-1919 alone.
Are Massive Deaths Only a Concern When They Are Political?
No one in the media or the financial markets had any concern in 2016 about the 15.2 million people killed from heart disease and stroke, yet fast, convenient foods are more popular than ever.
Lung cancers killed 1.7 Million people in 2016, yet tobacco can be found in just about any store. Some 1.4 Million people were killed in auto accidents, and no one is selling their cars from these dangerous high-speed metal machines, right? Firearms (held by civilians) are not even in the top 10 leading causes of death, but guess who is obsessing about that?
So what does this all mean?
Stuff happens.
However, we find a way to manage and solve the problem. All of these old viruses were eradicated by modern medicine that did not exist back then.
Today, the trend suggests fewer people are being killed in wars or by homicide. If history is any suggestion, the odds are this current media blitz over Covid-19 will be largely forgotten too in time.
Despite all these major historical events, people are living longer, and the financial markets have found a way to manage and still soar since 1792. Since most of us aren’t solving the worlds problems, how do we manage our own money in the financial markets during these apparent volatile times?
Try Not to Get Caught up in Media or Market’s Temporary Fears.
About 10 years ago I published an article on this site about Dollar Cost Averaging. What was true then, is still true today.
Historically speaking, the best way to navigate through volatile markets is having two things:
-
- Time. (Having enough time to ride out market volatility).
- Have an automatic regular investment plan. (Preferably a plan using at least in part, major market indexes).
Before we go into the investing part, we need to either get help from a professional, or if self-managing, open an account that holds the investment funds. For purposes of this article, we are focused on long-term retirement planning.
Help Can Be Beneficial.
Today, with the Internet and various apps, people can do much of this work themselves. It is easy to invest when markets move higher. It gets trickier if one doesn’t have much experience when markets correct (fall), or when recessions occur. An experienced financial advisor can help review before making hasty decisions especially during rougher down market cycles.
Investor Call Centers are not a good source for investment advice. Generally these are people who read scripts off a computer, have zero to minimum licensing, and usually have little investment experience. A professional personal advisor with preferably 15+ years of experience can help.
Next, Open a Retirement Account.
If you have an employer sponsored 401(k) plan, that should be maximized first, or as best as possible.
When looking at self-directed retirement accounts (IRA, Roth IRA, SEP, etc.), look at the annual costs to hold the account. These costs are usually subject to account management fees. If you manage the account yourself, you should try and pay zero. If you have access to a full-time advisor, paying a modest annual fee can be worth having access to ongoing personalized guidance.
By the way, when paying investment service fees, don’t debit the fees from your retirement account. You will lose the compounded growth of that money. Write a check and mail it in.
401(k) Basics.
Investment into an employer sponsored 401(k) comes out of a paycheck pre-tax. This means you don’t pay taxes on that money now, and instead you pay yourself first. Properly managed, your investments in the 401(k) grows tax deferred. This means you pay no taxes on the money until it is withdrawn, hopefully no earlier than retirement age.
There are a few exceptions on this, such as withdrawing money from retirement to pay for certain qualified education expenses, certain medical expenses, or purchasing a home. Generally, the only reason I see to withdraw money from retirement is for the purchase of a first home or upgrading as permitted by the tax code.
Mismanaging retirement money by withdrawing unnecessarily can be costly. There are tax and additional penalties that may apply; plus you lose out on the compounded growth of the withdrawn money.
The idea is when one retires, you don’t need to withdraw the whole wad of cash at once. One pulls money out as they need it, and allow the remaining to continue to grow. Typically one is also at a lower tax bracket during retirement than they would be during their peak earning years. Please see a professional investment and tax advisor before withdrawing money from a retirement plan.
Managing money during retirement should be reviewed by a professional advisor for risk tolerance, and overall expectations and economic needs.
No 401(k)? No problem.
If you don’t have a 401(k), and even if you are on a government pension system, you can still have a Roth IRA (Further info). You may also consider a traditional IRA for greater contributions and possible tax deductions.
Investments.
The biggest question I would always get is what to invest in. As discussed in my prior article, it’s difficult to just say just buy x, y or z, because people have different goals, risk tolerance and time frames. Although we don’t make personal recommendations here on what to invest in, we like to look at major market indexes such as the S&P 500 as part of a diversified large company index for long-term (10+ year) growth.
Vanguard still seems to have among the lowest (operating) cost S&P 500 Index fund. Whatever investment choices you and your advisor have made, here are the next steps to manage market volatility risk while building your investment portfolio over time.
A Simple Disciplined Investment Strategy.
- Make automatic monthly, bi-monthly (or per pay check) investing into one’s retirement account(s). When looking at mutual funds, remember to look at total costs to be in the fund such as management fees, including 12B-1 fees.
- If you don’t have an employer sponsored retirement plan, set up your own retirement account.
- Contribute a percentage of your income (employer sponsored plans) instead of a fixed dollar amount. That way as your income increases, so does your retirement contributions. If your income goes down, you are contributing less automatically. I generally tell people (depending on overall situation, age, etc.) to consider investing at least 10% of your gross monthly income into a retirement plan. IMPORTANT: Use retirement calculators to give you a theoretical scenario of how regular investing over time can help create a retirement nest egg. Start saving when you are young, but it’s never too late to start. Saving too little may not be enough to retire on. I never had a complaint with someone having too much money saved at retirement.
- For non-employer retirement plans, you can choose a fixed dollar amount (should be no less than 10% of gross income), preferably invested twice a month (or every pay period). Dollar Cost Average (again, monthly, bi-monthly, or per pay check) into (say) the S&P 500 index. Set it up to “reinvest all dividends and capital gains.” This last part is especially important, and makes a huge difference in your long-term returns. It’s free money, reinvest it! Read more – PDF from S&P.
- Finally, do this consistently and wait 30+ years (or at least 20+).
If you had to, you can get the PRINCIPLE out after 5 years in a Roth IRA. The profits must stay until one retires. Again, avoid the temptation of tapping into your retirement account unless you are planning to buy a home and assuming such withdraw can be done tax free.
Can I Dollar Cost Average Using Individual Stocks?
Yes, there are systematic investment programs available to buy fractions of shares of stocks, but generally this is not my favorite strategy because one is not as diversified as with the S&P 500 having the 500 largest companies in America.
For most people, index funds are the simpler non-emotional way for investing. Investing regularly through an automatic investment plan is a disciplined strategy.
How Dollar Cost Averaging Can Help.
If the market is high, one is automatically investing into fewer shares at the higher share price. If the market is falling, or even in recession, one is automatically buying more shares at a lower cost. When the market turns around, you will have more shares at a lower cost basis.
It generally takes less time to start seeing gains again than it does if one stops investing because the market is falling.
Ignore Political Hype.
What moves markets are not what a political party is or may be in power, but rather the policies that are anticipated and implemented by a party; what are the perceived then actual financial impact on corporate earnings, impacting jobs and the economy of those policies.
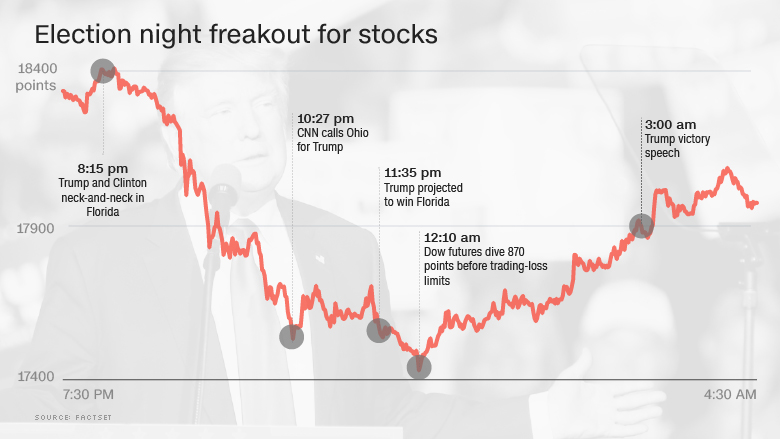
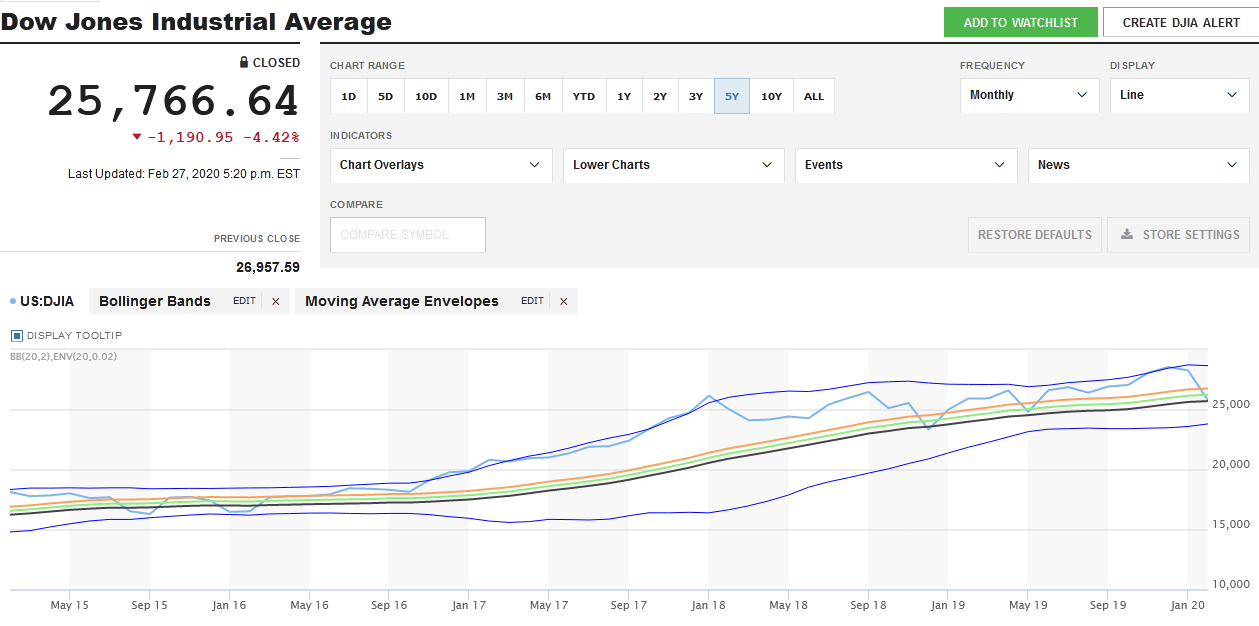
Note where the Dow Jones Industrial Average was on election night 2016: 18,400. Look where the Dow is today. If the market is higher it is generally because of successful policies were implemented that supported companies to prosper, thus moved stock prices higher. As companies make a profit, such creates jobs and income for people to spend, and invest, further helping the economy.
Longer term, if polices that helped grow the markets and thus the economy change, market prices will also change accordingly. The market will then re-price stocks to adjust to the anticipated, then actual changes of new policies by government and by companies.
Ignore Media Hype & Fear.
The media tends to be a deer in the headlights. Every day there is a new shinny object to focus on. Shortly after the news story dies, there is something new to try and get viewers to watch.
When it comes to financial news, most of the media spends 5 seconds a day at best to state where the Dow closed. They probably missed talking about the billions of shares that exchanged hands in a single day, and the many factors that drive prices higher or lower over time.
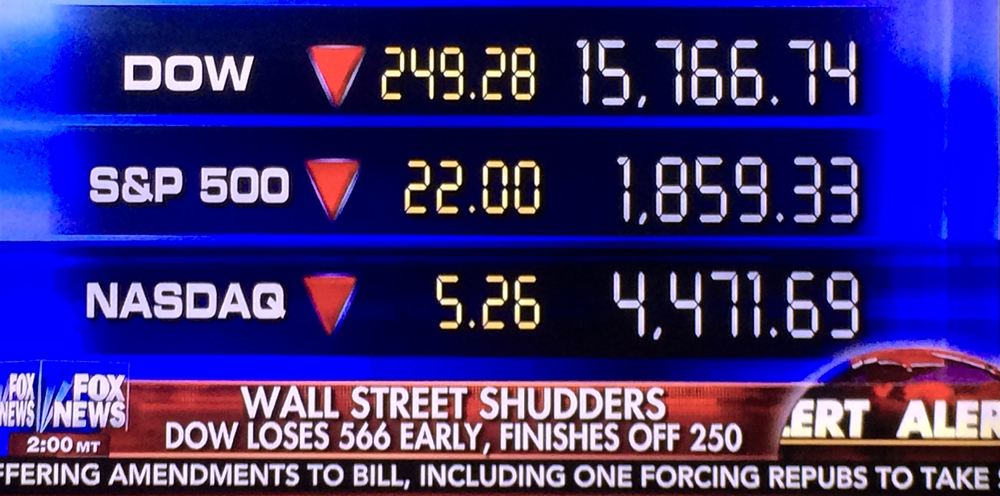
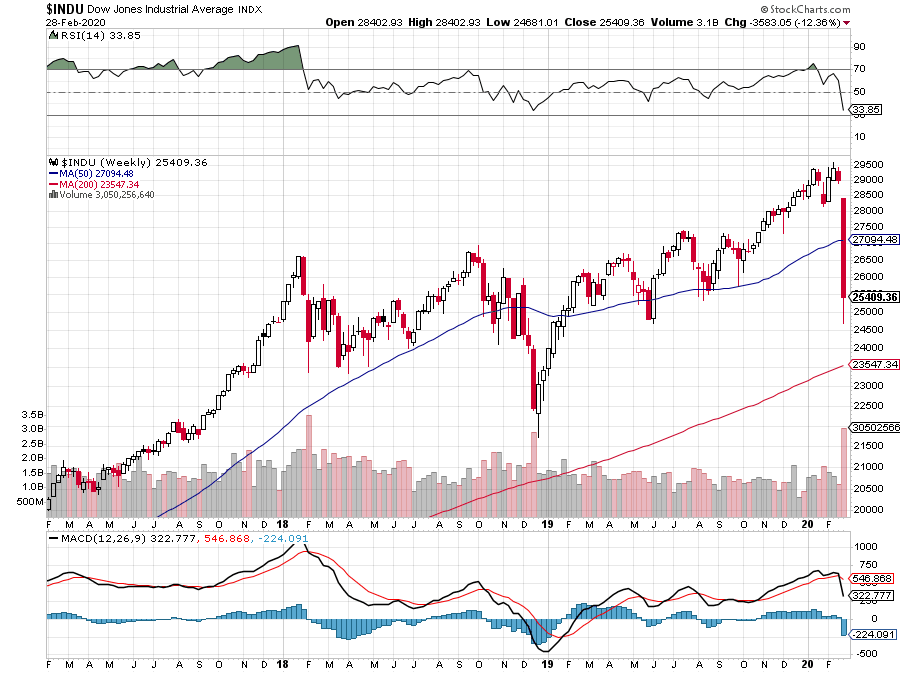
Despite the market fall in January 2016; another fall in November 2016, and yet another fall in February 2020, the market is still significantly higher – a gain of 63 percent since November 2016.
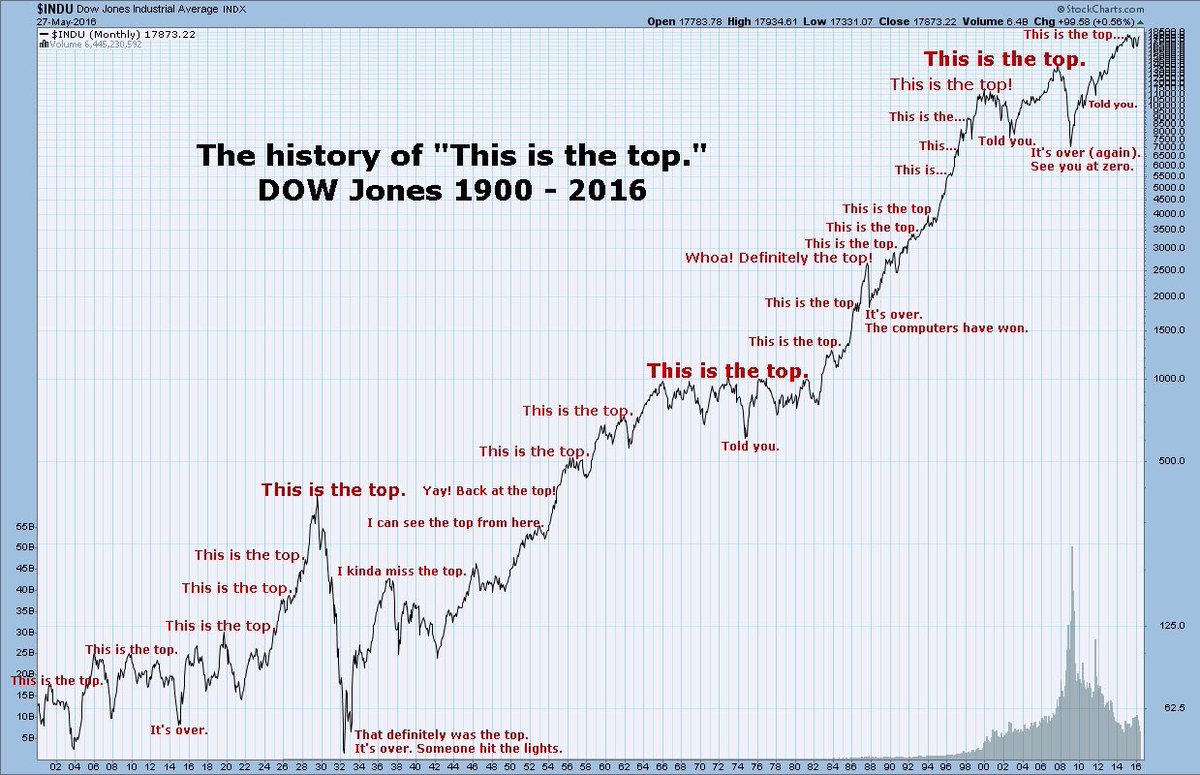
Think Long Term.
Back in the 1990’s, the investment mantra was that people should be invested for 3-5 years to ride out down markets. The 2006-2010 real estate credit crisis crash changed all that. Now, the mantra is that people should look at a 10+ year time line. If you are investing for retirement, one should be looking at several decades of investing anyway. Even in retirement, one still wants to be invested because one may live twenty or more years after they retire; and that is a lot of time for continued money growth.
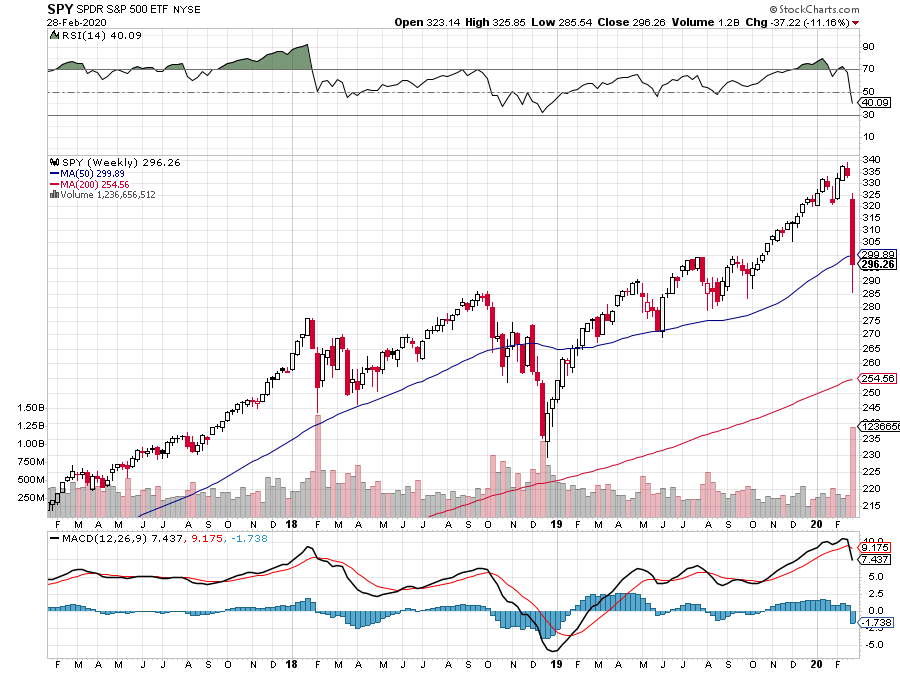
Two years isn’t much time for investing in the stock market. For those who want to see a 2 year chart of the S&P 500:
“Panic Buying:” or Chasing returns: ‘The market is soaring, and one jumps in which happened to be the market top.’
– or –
“Panic Selling:” ‘All those gains I had are going away. So I better sell to keep some of them, or sell now from not losing, and then get back in the market when things settle down.’
Both of these panic moves are based on emotion, and not on a systematic strategy such as dollar cost averaging.
Sure, people can make money on market timing, but most don’t. If one is not a full-time expert professional with the right technology subscriptions and sophisticated know-how, avoid market timing, and here is why.
Market Timing.
One of the old stock market adages is that you need to have ‘time in the market’ and try not to spend too much time ‘timing the market.’
From 1997-2017 the U.S. has two major recessions. This included the .com tech bust (2000-2002), the Sept. 11, 2001 domestic terror attacks in the USA, to the housing credit-crisis crash (2006-2010). There were thousands of other smaller events that could be added where market pundits and some media freaked people out with news stories that are irrelevant to the long-term market potential.
According to Morning Star, if one stayed invested (using large company diversified stocks) during the entire 5,517 trading days (10 years of market trading days, again 1997-2017), the end result was a +7.2% gain. Not bad after two lengthy market crashes and major domestic terror attacks.
Yet, if one tried to time the markets, and missed just the 10 best trading days during this same period, the investment return would have been cut in half to +3.5%.
If one missed the best 30, 40, or 50 trading days (out of 5,517 trading days – 10 years), the investment return would have been in the loss category (see chart). We have seen these type of charts covering market periods from the 1920’s. The data suggests that long-term investing is a better way to ride out volatility, wars, recessions, depressions, etc.
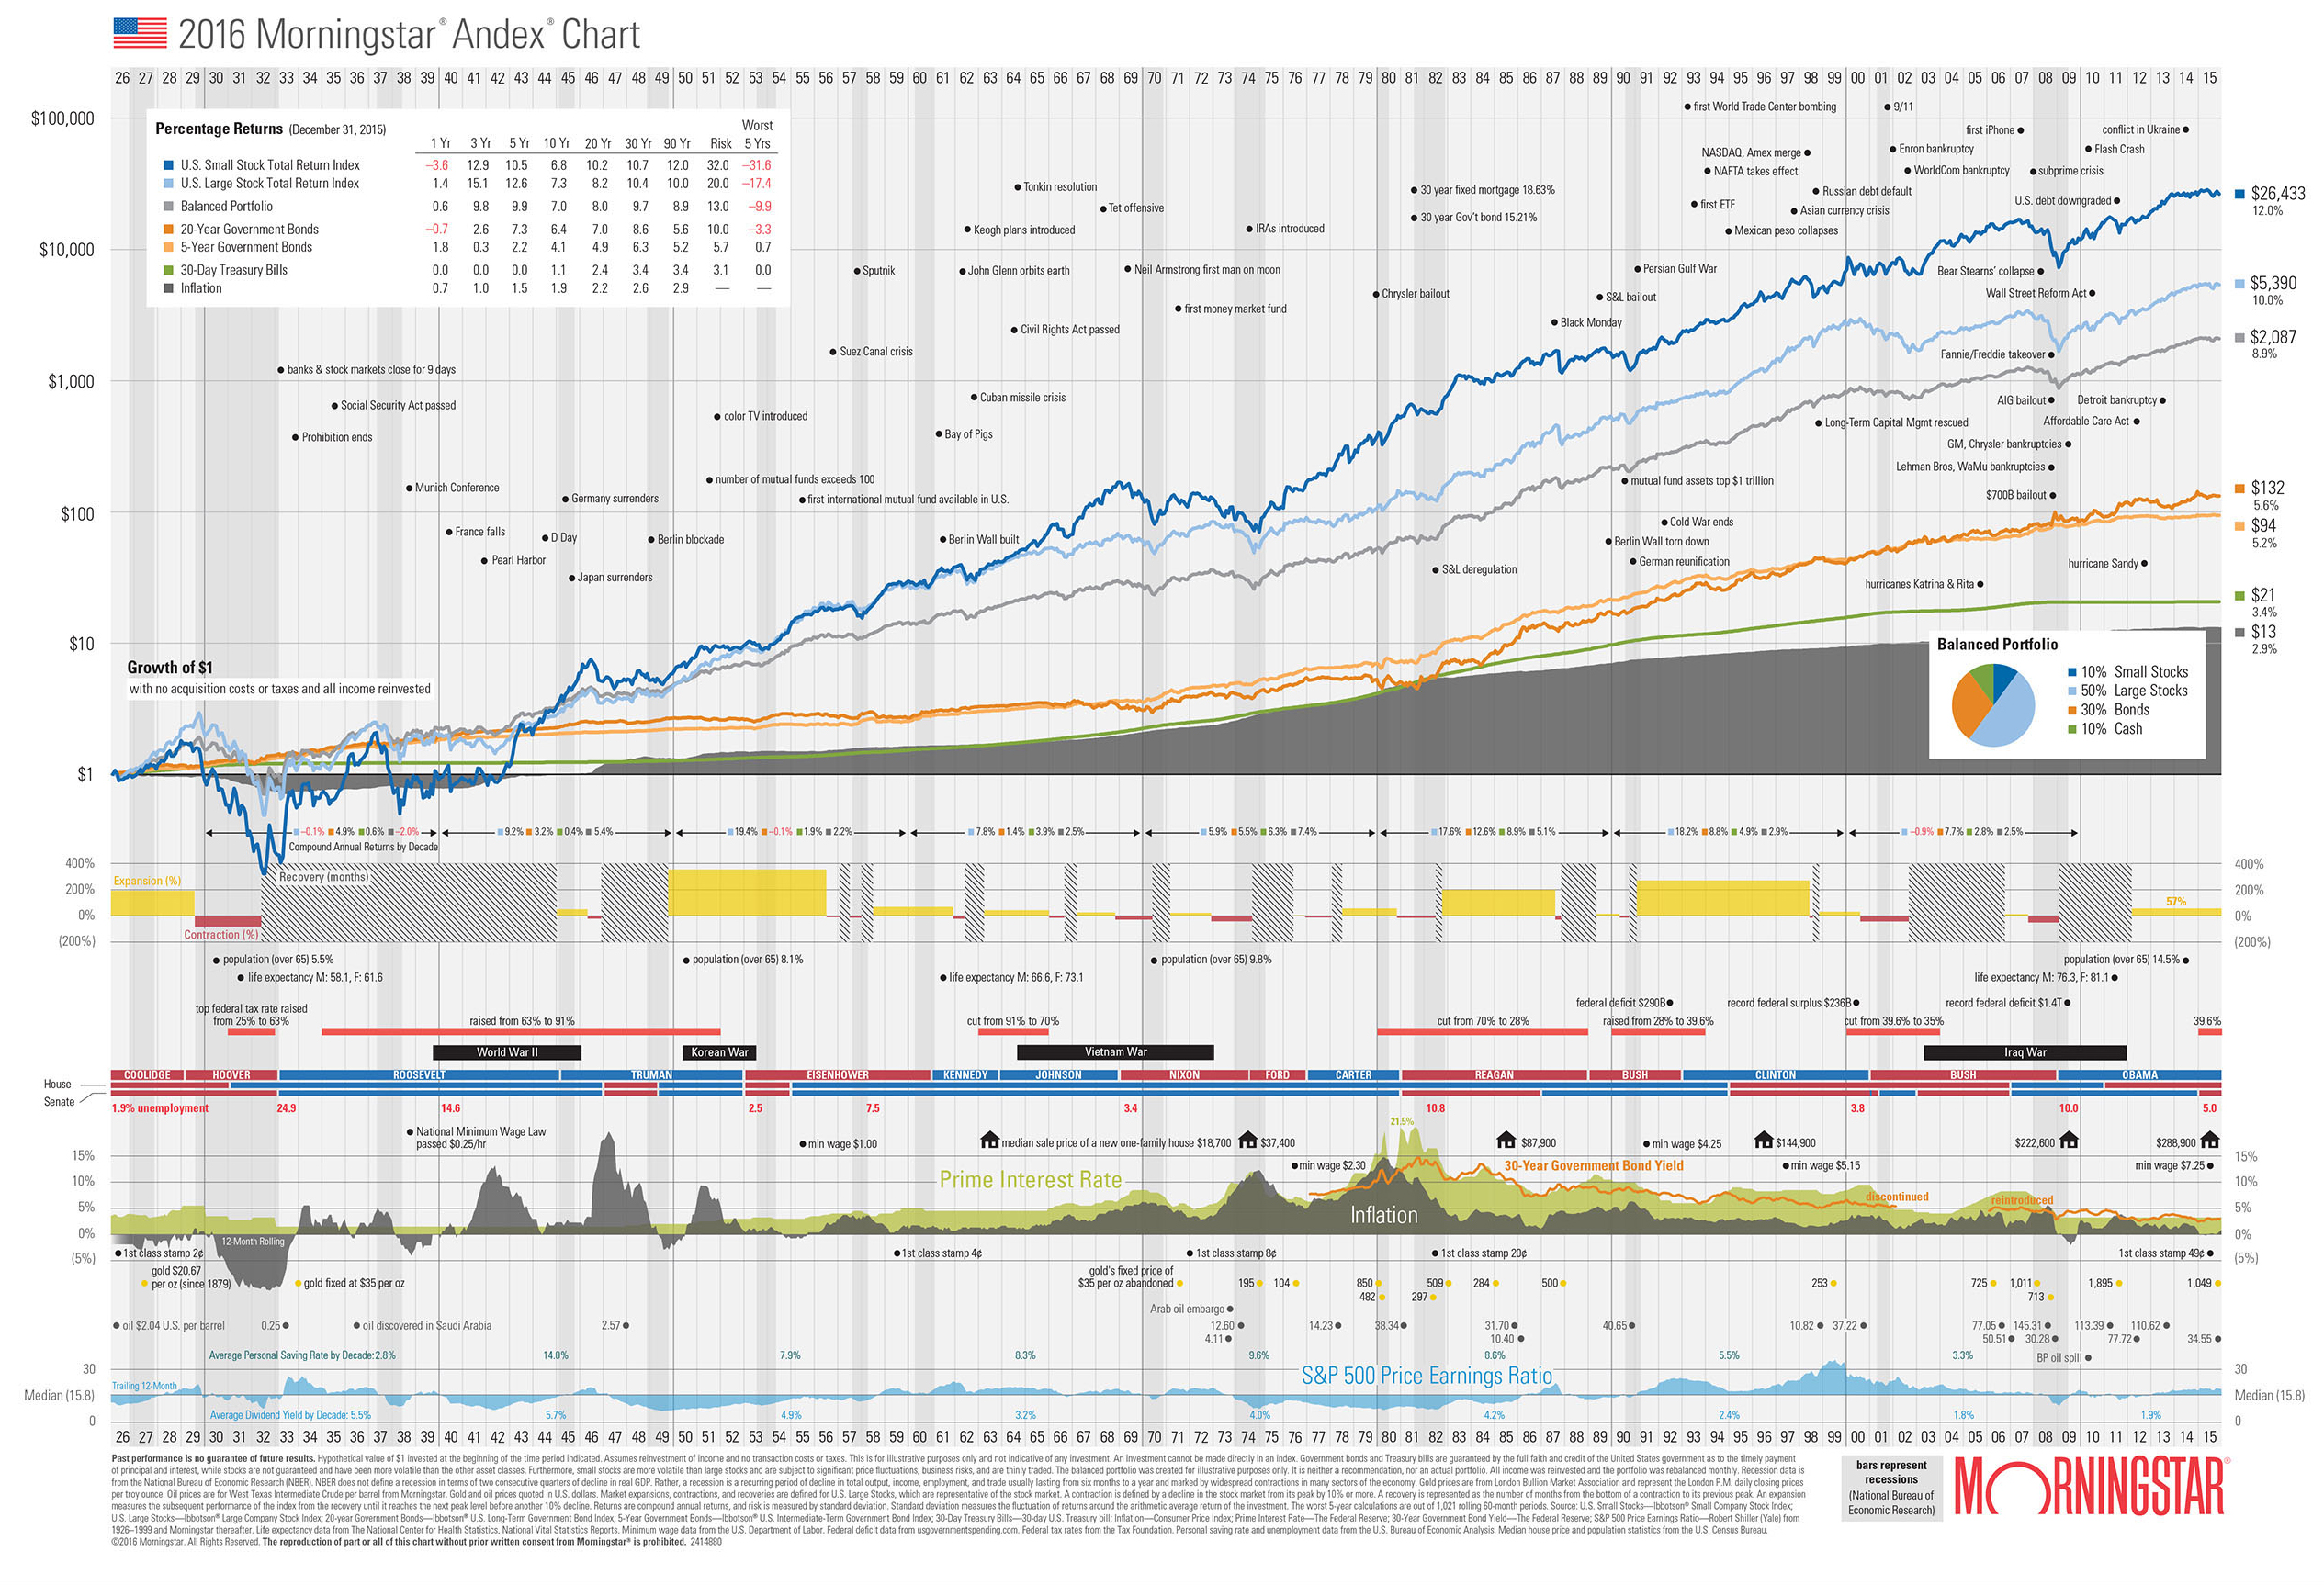
Keep in mind that these charts apply to large cap U.S. companies such as found in the S&P 500 index.
Long-term market growth also assumes that the U.S. maintains a market-based economy. If in the event, the U.S. moved further into a socialist-government controlled industry environment, such would have a severe impact on stocks, earnings and thus on U.S. jobs and one’s personal financial situation.
Either you can monitor this last risk and hopefully be independent of personal bias to understand the economic impact of such policies; or find an advisor who can help guide you with any concerns.
NetAdvisor™ is a former nine-time state, FINRA licensed, 401(k) and retirement planning specialist, experienced in hedge fund management, and a financial and risk management consultant. Read more bio.
This is not an advertisement. This post is for investor educational purposes and is not an advertisement to buy or sell securities.
NetAdvisor™, NetAdvisor.org® nor anyone associated thereof, do not receive any compensation or other benefit for this, or other posts mentioning any companies, indexes, etc., as discussed hereto.
Disclosure: As of post date, NetAdvisor™ holds shares in the S&P 500 Index and uses dollar cost averaging as discussed in this article. Disclaimer.
Graphics copyright by their respective owners.
Original article content, Copyright © 2020 NetAdvisor.org® All Rights Reserved.
NetAdvisor.org® is a non-profit organization providing public education and analysis primarily on the U.S. financial markets, personal finance and analysis with a transparent look into U.S. public policy. We also perform and report on financial investigations to help protect the public interest. Read More.
