August 14, 2019
written by Net Advisor™
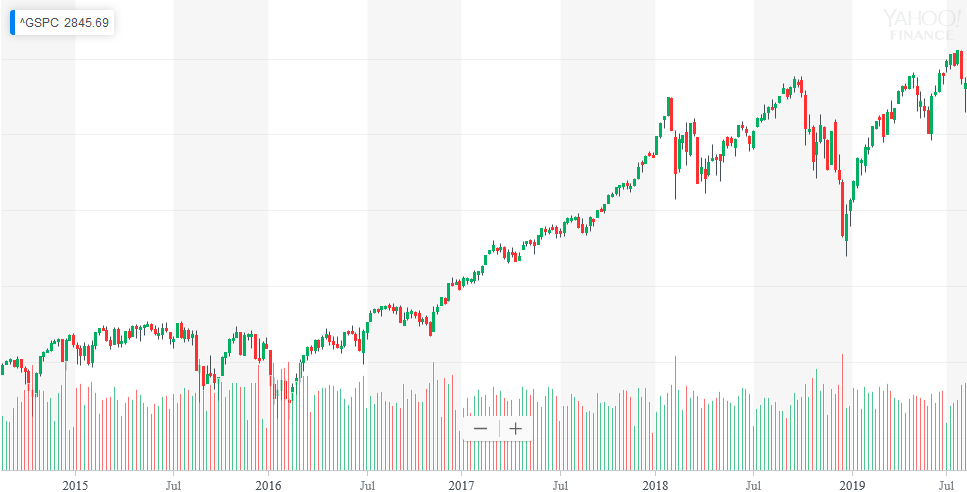
MANHATTAN, New York. The U.S. stock market has soared nearly 45% since the 2016 election.
The stock market’s broader benchmark, the S&P 500 Index was relatively flat during 2014-2015. The S&P had a modest drop right before the 2016 election as Hillary Clinton was determined the winner by pre-election polling. CNN reported stocks (Dow Jones – DJIA) soared 257 points the very next day after Donald Trump was determined the winner of the election, with the S&P 500 and NASDAQ up 1.1% each.
By December 2016, CNN noted again that the Down climbed 1,200 points (only AFTER) the 2016 election and cited Trump as the reason for the move.
We attribute the move was in anticipation of large corporate, individual tax cuts, and massive rollback in government regulations on business (See our 2018 report).
Stocks Soared From Tax and Regulation Cuts.
The result of such tax and regulation cuts, brought back huge new investments, jobs, including lost manufacturing jobs back to the USA. As a result, stocks (S&P) soared 44.67% through July 22, 2019.
Market Climbed a Wall of Worry.
In January 2016 (Obama Admin), the stock market had it’s worst start since 1932. China continued to manipulate their own currency, by de-valuating it. This makes China goods cheaper and U.S. made goods sold in China more expensive. There was concern of a global economic slowdown. Additionally, weak U.S. economic data in manufacturing was also a problem.
However, the bigger economic risk was more on China. The Shanghai Index fell 6.9% on January 4, 2016. Leading U.S. stock indexes fell 1.5 to 2%. EU stocks fell 2.3 to 4% on the news. China’s manufacturing data pointed toward contraction (slowing growth) as the China economy moves from a manufacturing to consumer-driven economy. U.S. markets continued to fall in early 2016 on this negative China economy news.
Despite the negative China data, the stock market continued to climb a ‘wall of worry’ and soar. Again, we attribute this to the above said economic policies of the Trump Administration.
China Stocks Plummet 47% Before Trump Was Elected.
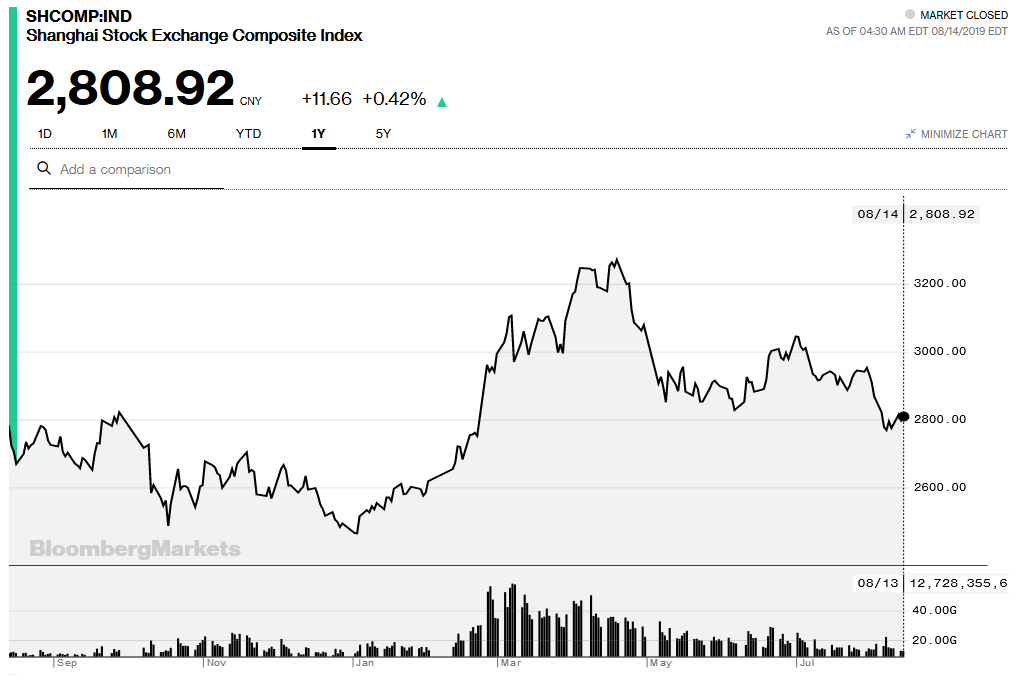
China’s stock market began to tank since 2015 – before Trump was elected, and before the ‘Trade War.’ On June 12, 2015 the Shanghai Index stood at 5,166.35. By January 2016, the index fell to a low of 2,737.60 or -47.01% (chart below).
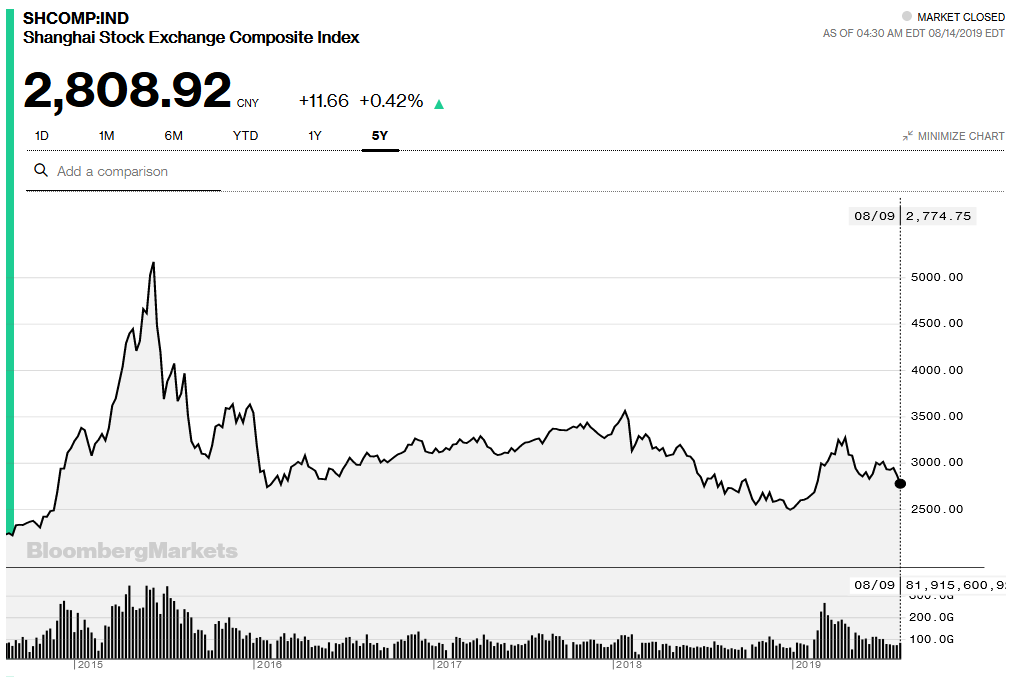
By April 19, 2019, the Shanghai Index bounced around to recover +18.72% from steep losses to 3,250.20. But as trade tariffs on China continue to be an issue for China, the Shanghai Index fell again -13.58% to currently 2,808.92 (2019 Chart).
China Slowdown – Not New, but Accelerating From ‘Trade War.’
This China slower growth news is pretty much the same news today as it was in 2016. There are two differences.
1. China’s economy is being hit harder from U.S. trade tariffs. For the first time, the U.S. is finally standing up to China who have been de-valuating their currency (currency manipulation) for decades to gain competitive market edge.
2. The U.S. Federal Reserve has also played a role in the U.S. economy.
3. Inverted Yield Curve also spooking the market. More on this one later below.
1. China Showing Biggest Loser in ‘Trade War.‘
The first year in U.S.-China Trade War cost China $20 Billion just on their exports.
By July 2019, some 50 major international companies have fled China and moved to other nations to do business. The companies are fleeing China because they don’t want to pay U.S. trade tariffs for manufacturing goods in China. China’s economy is expected to grow at a 30-year low in 2019.
Countries who have allowed China to make them dependent on China’s goods are being hurt the most. The solution is to create more domestic manufacturing, thus become less depending on cheap China labor market.
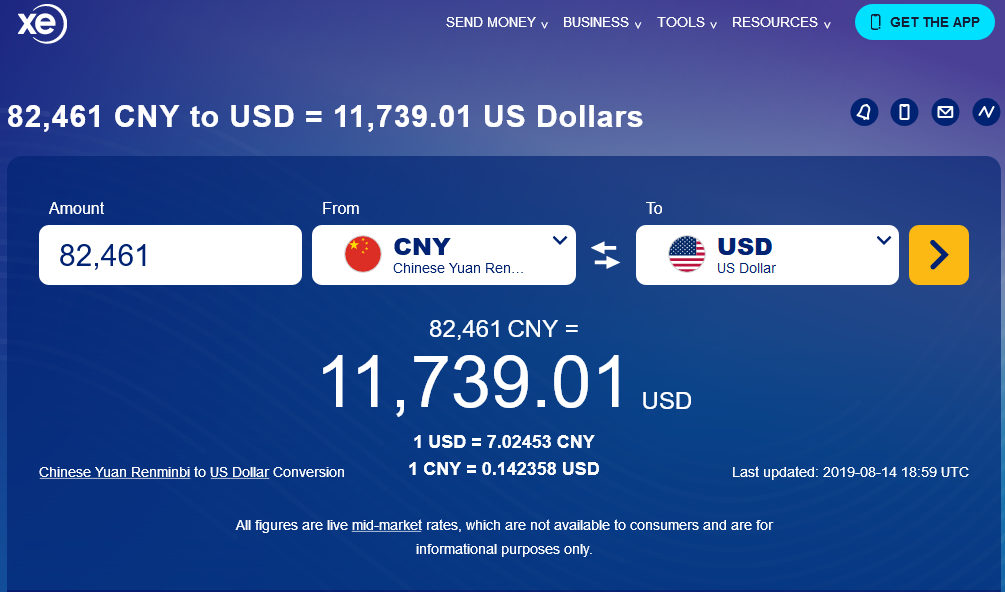
China Wages up 65% Since 2009, but Still Poverty Level by U.S. Standards.
China annual wages up about 65% since 2009. Annual average wages in China were at 82461 CNY/Year in 2018 versus 76121 in 2017. Thus the average annual wage in China (converted to U.S. dollars) is about $11,739.01 as of the date of this post, below the poverty level by U.S. standards.
Counter Punch China.
To counter the trade impact on U.S. farming markets, the Trump Admin is subsiding farmers with about $16 Billion to offset the costs of goods traded with China. According to factcheck.org, the CBO is projecting to collect $74 Billion (cash) from trade tariffs (fees) from China in 2019. This number could go higher depending on newer trade tariffs that may be pending. Thus, the U.S. can afford to make these subsidies with the China tariff offsets.
So now we know the biggest international economic issues are with China, and that these economic issues with China have been ongoing well before Trump was elected.
So what is the seconod part of this equation that can be contributed to spooking U.S. markets?
2. The U.S. Federal Reserve Played a Role in the U.S. Economy.
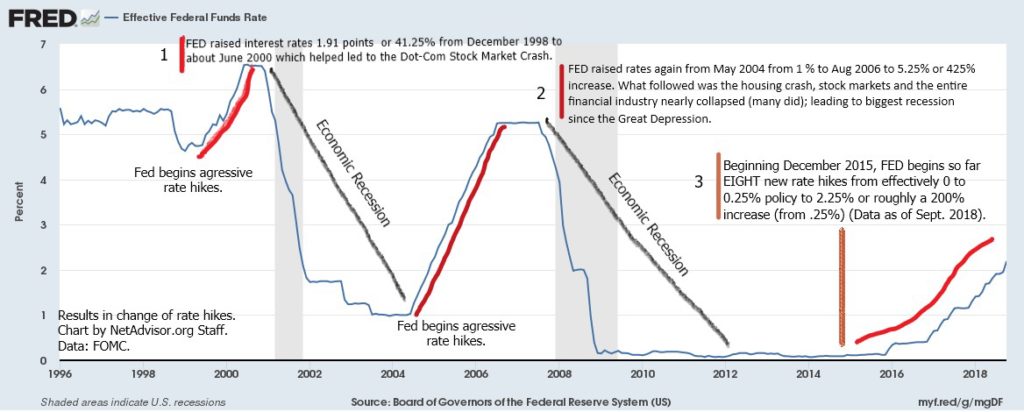
On December 1, 2018, we posted a new chart (below) of the Federal Fund Funds Rate (FFR). In short, the FFR is the annual rate that the Federal Reserve charges member banks for overnight loans.
The FFR is tied to consumer interest rates such as the Prime Rate. As the Fed increases FFR, banks then pass on these higher borrowing costs to consumers and businesses for bank loans. Common loans that are impacted by interest rates are credit cards, home mortgage, auto loans, business loans, and the U.S. National Debt.
As we stated our concern in 2018, the Fed was taking actions by raising the FFR unnecessarily, which could lead to a negative impact on higher bank interest rates. The result raises the costs to consumers and business. As consumers pay for more in interest on borrowed money, reduces their free spending that could be used to buy things that helps grow the economy.
As businesses face higher borrowing costs, this reduces their profits, negatively impact financial markets earnings projections and thus impact the economy.
What the FED?
Historically, the Fed has been notorious for raising interest rates too aggressively which had tended to lead to economic slowdowns and recessions (chart above).
The way to reduce this risk is to closely monitor economic data. If there are continuing early signs of slow sown, the FED should begin to remove the rate hikes to ease up on the economy. The problem in the Fed tends to wait too long to do this.
As the chart above shows, the FED aggressively (and we argued in 2018, unnecessarily) raised rates by roughly 200% from .25% to 2.25% through September 2018.
The U.S. economy grew 2.1% in the last quarter, down from 3.1% in the first quarter. This slowdown finally got the FED to realize that maybe they raised interest rates too much, and that has slowed U.S. economic growth.
The Fed may be trying to fix this mistake, but albeit too slow. The Fed just cut rates by one-quarter of a percent (.25%) on July 31, 2019. As CNN reported, this is the first rate cut since 2008.
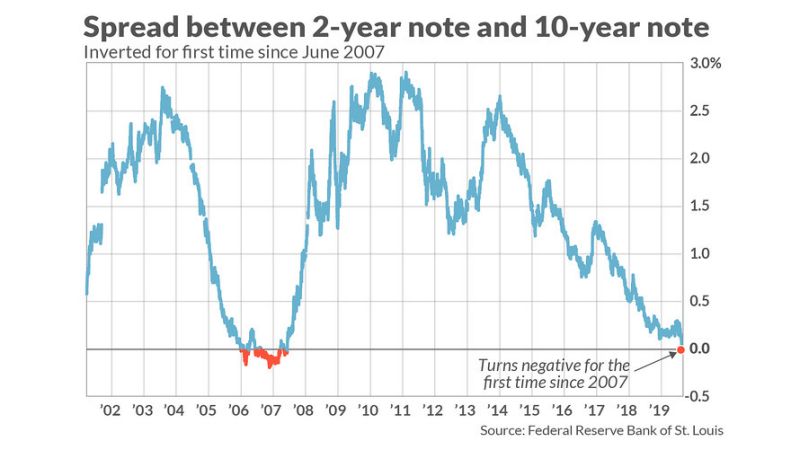
3. Other Market Concern: Not China, Not Trump – Bond Yields.
The stock market is not spooked so much about China, or President Trump’s policies. They are more concerned about inverted U.S. Treasury Yield Curve.
If you understood the last two segments and just said, ‘WTH!’ (or similar) don’t worry, 99.9% of the planet doesn’t know or care to know about this.
Basically, the concern is that shorter term rates on government bonds (debt) are higher than longer term bond rates.
The U.S. Treasury Yield Curve has been trending negative since the Obama Administration beginning in 2014. The U.S. economy was still in technical recession in 2008-2010 when the yield curve was soaring. From 2011-2012 when the yield curve tanked, the U.S. economy did not fall into a new recession (Chart: below).
The stock market can get caught up with odd data and overreact. The higher short term rares are heavily impacted by rate movements by the FED.
Note: U.S. Presidents, nor Congress controls interest rates. Thus, no one can blame any current or past President for changes in rate policy – that is sole up to the FED.
One solution aside from lower FFR is that Congress needs to have real spending cuts and spend our tax dollars withing their means.
As the U.S. National Debt increases, the interest cost on this borrowed money increases; as the Fed increases borrowing costs, the government interest cost on borrowed money also goes up. We have been discussing this problem publicly for the last nine years.
This deficit spending is a problem for BOTH political parties, and more spending is not the solution to lower debt or growth.
If unsure, max out all our credit cards, spend all your money, spend all your savings, then see how you are doing a few years down the line. Did you create wealth and prosperity?
No?
We’ll that is exactly what government thinks they can do by spending more and more of your tax money. That economic model never works.
2020 Stupidity.
The U.S. financial markets prefer consistency and stability, but financial markets are anything but stable and profit off volatility. It has been said that China may wait until after the 2020 election before making any changes in their policy. China may hope to get someone new as U.S. President who will suck up again to the Communist regime and remove all the trade tariffs, and export American and other jobs back to China.
We think Trump has a very high likelihood of being reelected. The thought of a new President exporting American jobs again, and allowing China to continue to manipulate their currency unchecked, dumping steel and other industrial goods in the U.S. below costs which kills American (mostly Union) jobs, thus reduce competition, will negatively impact the U.S. economy, not China’s economy.
The U.S. has anti-dumping, anti-competitive laws in place since the 1930’s. The problem has been most modern U.S. Presidents have done little to nothing to stop China’s unethical trade practices beginning with President Richard Nixon who permitted open trade relations with China.
In fairness to the former crooked President Nixon, he, nor Congress may not have foreseen China’s intent to secretly lie, cheat and steal from America to grow China’s economy.
Trump is arguably the first President who is seeking to even the playing field with Communist China and succeeding. It can be a bumpy ride, but to change to a more fair and competitive landscape for U.S. workers, the tariffs must continue until China complies. If the U.S. continues to go after China on trade, the U.S. is expected to win the ‘trade war.’
Real problem for the U.S.
The bigger problem as we see it is the aggressive rate hikes by the FED. These hikes don’t immediately impact an economy overnight. It can take six to twelve months for a single rate move to flow through the economy. The Fed raised rates eight times from December 2015 to September 2018. Thus, a single rate cut on July 31st will likely have little impact.
In the short run, the U.S. stock market was overdue for a correction.
Market Overdue for a Correction.
We think the market has been way overdue for a healthy correction, say 10% or so. Markets can’t go straight up or down forever. At some-point people take profits or start buying when prices look cheap.
The market is currently down 5.55% from its high in intra-day trading, August 14, 2019 (See chart, page top). So we may have some more selling (profit taking) coming up.
If one is looking for blame, start with Congress who has an uncontrolled spending addiction; Then the Fed who manipulates interest rates frequently at the wrong time. The result of the two is an ongoing problem that leads to volatility in the market.
What we can do as consumers aside from pressuring Congress to spend withing their means, is dollar-cost-averaging in the market.
If you liked this article, please “like us” on Facebook or share on Twitter or through your favorite social network. We are a non-profit education media org. Original content copyright © 2019 NetAdvisor.org® All Rights Reserved.
NetAdvisor.org® is a non-profit organization providing public education and analysis primarily on the U.S. financial markets, personal finance and analysis with a transparent look into U.S. public policy. We also perform and report on financial investigations to help protect the public interest. Read More.
