January 21, 2017
written by Net Advisor™
WASHINGTON DC. Before this report, I have researched and discussed 33 articles and reports concerning just the U.S. Deficit and the National Debt.
On January 30, 2010, I said, “President Obama’s “Change” Will Cost You $9.3 Trillion+ Interest.” This report covers the results of my 2010 prediction of where the U.S. National Debt would be at the end of President Obama’s term.
[1] Debtor-R-US
Our last two Presidents, one “Republican,” and one “Democratic,” racked up some $14.22 Trillion over 16 years. If you wonder why I put their parties in quotations, this report discusses that.
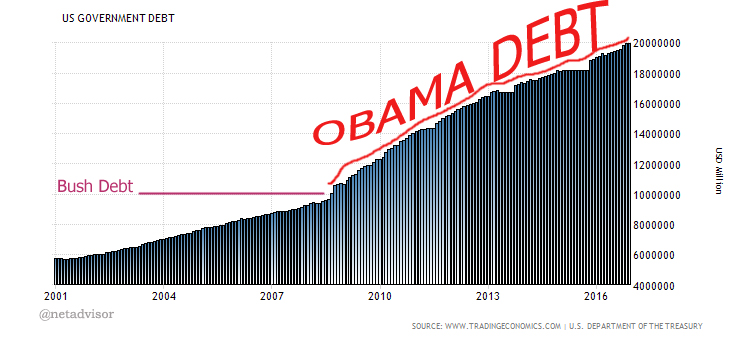
The Bush Deficit (8 years): $4.9 Trillion
Under a Republican, Democratic, and a Bi-partisan Congress, the end result of debt attributed to President Bush over his eight-year term is $4.9. Trillion.
The Obama Deficit (8 years): $9.32 Trillion
According to the U.S. Treasury, as of Thursday, January 19, 2017, the total outstanding U.S. National Debt stood at $19.944 Trillion and change.
Under a Democratic, Republican, and a Bi-partisan Congress, the end result of debt attributed to President Obama over his eight-year term is $9.32 Trillion.
In percentages terms, under Obama’s watch the U.S. National Debt increased 88% (rounded).
So how did I do with predicting the Obama debt 7 years ago?
Obama Debt Prediction in-Line With Expectations
Jan. 30, 2010: Obama debt would cost “$9.3 Trillion plus interest.”
Jan. 19, 2017: Obama debt cost taxpayers $9.3 Trillion plus interest.
So unfortunately I was correct in projecting the debt that President Obama would create during his term. Next, we examine the debt-to-GDP under Bush and Obama what that means.
[2] Obama Out Spent the Entire U.S. Economy
Although most no one else will say this, but the U.S. is in technical bankruptcy if you look at Debt-to-GDP.
Before people freak out about U.S. bankruptcy, under the Constitution, Congress can raise the debt ceiling and tax people basically to death to pay for their debt. So with an unlimited credit card, the U.S. is not officially bankrupt, nor has it ever defaulted on its debt as of now.
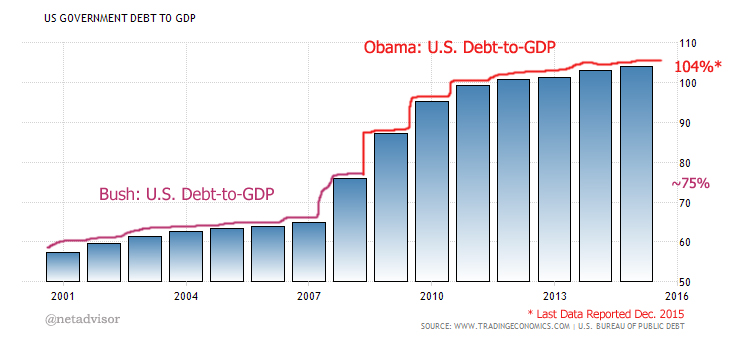
The concern here is that government debt spending is far outgrowing the rate of growth in the U.S. economy. The result is a debt-to GDP that currently exceeds all the revenues and assets produced in the U.S. economy. To put this is simpler terms, the U.S. owes more than it can possibly tax or produce.
Under Bush’s term, the U.S. Debt-to GDP hit a high of about 75% during the peak of the 2008 recession. Millions were unemployed, other people not spending so much, less taxes collected on lower incomes and continued government debt spending drove this number up.
Yet, under Obama’s so called “Economic Recovery,” U.S. debt spending soared even more with record taxes collected to the point where U.S. debt exceeded the entire value of the U.S. economy (over 100%).
[3] Real Household Median Incomes FELL Under Obama
All this government spending didn’t create utopia for the average person in the USA. According to the U.S. Bureau of the Census and St. Louis U.S. Federal Reserve Bank found that average (medium) household incomes fell under Obama.
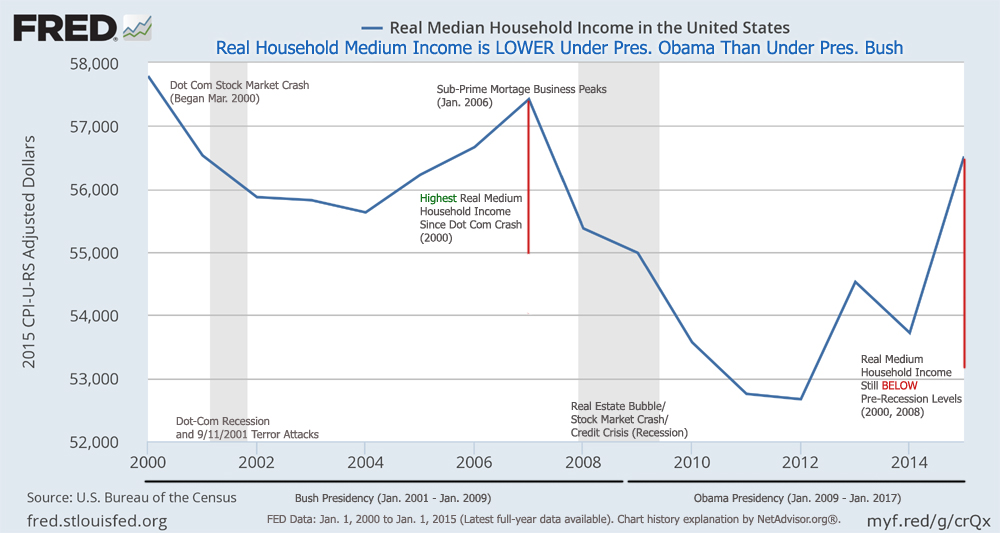
Click Above Chart to Enlarge View.
The above chart shows the average (medium) household income plummeting before and after the last recession. Incomes went up in 2013, fell in 2014, and up in 2015. The FED has not published 2016 data as of the date of this report.
The chart also shows that the average U.S. household has seen their income generally fall (trend lower) for the last 15 years (with a few exceptions). Yet, two presidents, one from each major political party spent a combined $14 Trillion+ and that did not solve American’s household income problem.
The chart also shows that despite the claims of the “Obama Economic Recovery,” the average household is earning less than before the 2008 recession.
Obama’s legacy has left America where the government grew nearly eight times faster than Real Economic Growth [Point 7], and the average U.S. household income fell at the same time. Clearly more government spending did not create an economic recovery for the average U.S. household.
Credits: Graphics may be copyright of their respective entity whether or not noted. Additional info by netadvisor.org staff.
Publishing Note: In the past we start out articles and reports as “original article/ report written by Net Advisor.” For 2017 and until further notice, we will just shorten this to “written by Net Advisor.” All of our articles are original unless noted and cited by major 3rd parties were noted.
original content copyright © 2017 NetAdvisor.org® All Rights Reserved.
NetAdvisor.org® is a non-profit organization providing public education and analysis primarily on the U.S. financial markets, personal finance and analysis with a transparent look into U.S. public policy. We also perform and report on financial investigations to help protect the public interest. Read More.
