
Propaganda Exposed: U.S. National Debt Up 79 Percent Under Obama
Original article written by Net Advisor™
WASHINGTON DC. Many on the political left have carried this fantasy about President Obama LOWERING the deficit over the last seven years.
They use what I call deceptive economic math to try and support their misleading narrative. Here is an example of their logic.
[1] Political Propaganda
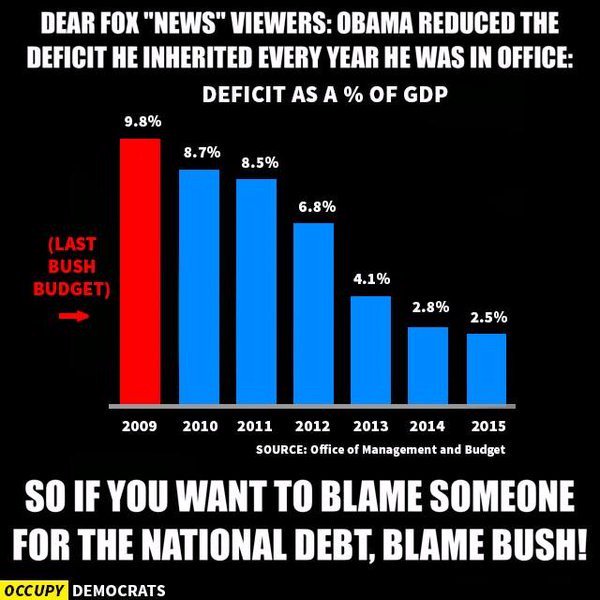
If anyone has any doubt how ridiculous this math is (black graphic above) then try this:
- Buy a new car. Doesn’t matter if you can afford it.
- Go max out all your credit cards.
- Borrow against all other credit-lines, especially your home.
- Be sure that your total debt EXCEEDS your ability to ever pay it back.
- Now for the next 7 years, keep borrowing, though add a little less debt than you borrowed the previous years.
Now you can say you have ‘reduced your deficit over the last 7 years?’
This false logic just doesn’t stand when real data is entered. The facts are ACTUAL U.S. debt increased each and every year where the above black chart is concerned. If one followed this Liberal math, such debt should put one on the path to bankruptcy. We first discussed this false logic in 2010.
Let’s further examine the claims in the said graphic above. We can easily dispute the “Last Bush Budget” nonsense right away. Bush’s own budget was never approved by the 2007-2011 Democrat-controlled House and Senate (Report, Point [6]). Bush did sign the 2009 budget, but it was not his budget – it was the Democrat’s budget. That means the 2009 “Last Bush Budget” claim is FALSE.
Next, we examine the deficit reduction claims. Even if one breaks-down the propaganda chart, actual U.S. debt has gone up, not down under Obama.
| Year | U.S. National Debt ($Trillions) | National Debt Increase ($Trillion) |
| Jan. 20, 2009 | $10.626 | |
| Jan. 20, 2010 | $12.327 | $1.701 |
| Jan. 20, 2011 | $14.056 | $1.729 |
| Jan. 20, 2012 | $15.236 | $1.180 |
| Jan. 18, 2013 | $16.432 | $1.196 |
| Jan. 21, 2014 | $17.276 | $0.844 |
| Jan. 20, 2015 | $18.086 | $0.810 |
| Jan. 20, 2016 | $18.941 | $0.855 |
| Feb. 18, 2016 | $19.047 | $0.106 |
| Total Debt INCREASE | $8.421 | |
| Avr. Debt Last 7 Years) | $1.20 |
— Spreadsheet Chart Data Source: U.S. Treasury (PDF, 53pps).
The way to reduce a deficit (or debt) is to:
- Not borrow at all.
- Spend less than you earn.
- Pay down existing debt.
[2] Let’s Look at Some More REAL Numbers:
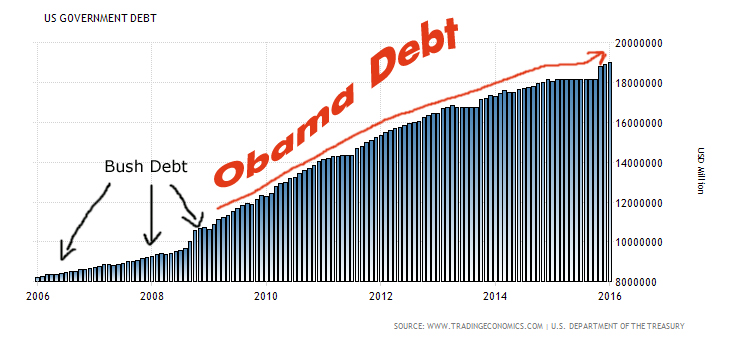
Chart shows the massive change of debt INCREASE under Obama through February 2016.
Total National Debt (Chart Above).
The above chart shows how U.S. debt has soared far beyond what the Bush debt ever racked up.
The Bush Deficit (8 years): $4.9 Trillion
In real numbers, the facts are that under a Republican, Democratic, and a Bi-partisan Congress, the end result of debt attributed to President Bush over his eight-year term is $4.9. Trillion [Source: CBS News (PDF)].
The Obama Deficit (7 years): $8.42 Trillion
As of Feb. 18, 2016, the U.S. National Debt has INCREASED $8.42 Trillion to over $19.047 Trillion under President Obama. In percentages terms, under Obama’s watch thus far the U.S. National Debt has increased 79.25%.
I am predicting that the U.S. National Debt will EASILY hit over $20 Trillion before Obama leaves office.
If we look back to January 30, 2010, based on the data at that time, I predicted that ‘Obama’s “Change” will cost you (America) $9.3 Trillion (plus interest).’ Right now, it looks like the U.S. will easily hit that principle debt prediction of $9.3 Trillion by the time Obama leaves office in January 2017.
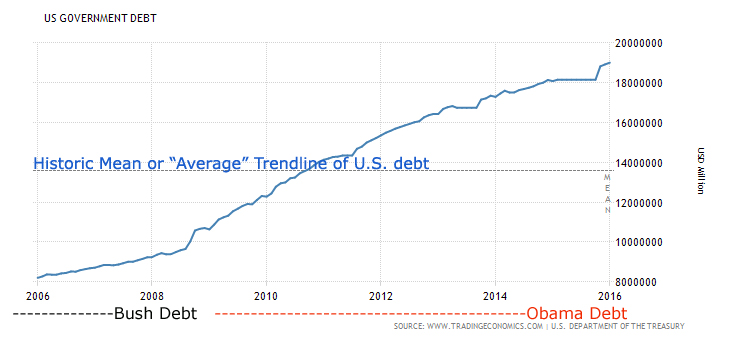
Chart shows historic mean (Average trend line of how much and how rapidly the debt has increased over time).
[3] Average Debt Trend
The average U.S. debt is trending at an alarming rate. The above chart shows the historic mean or the average trend line of how U.S. debt increased since 2006. The rise of ‘Obama’s debt’ is soaring relative to the debt under George W. Bush.
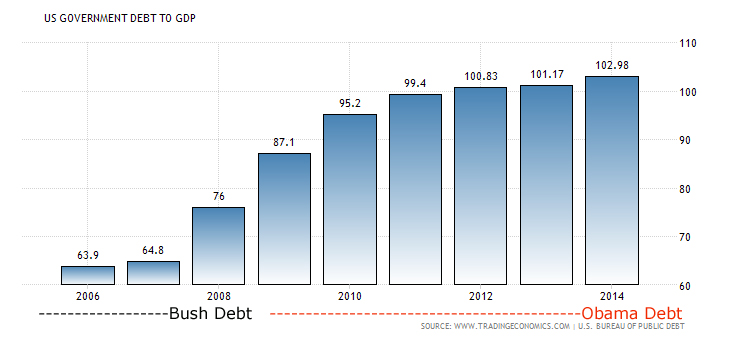
Chart shows U.S. Debt-to-GDP through February 2014 (last data available per TradingEconomics.com).
[4] United States Debt-to-GDP
The chart shows U.S. Debt-to-GDP through February 2014 (last data available per TradingEconomics.com). Under President Obama, the amount of U.S. debt has exceeded the entire economic output of the U.S. economy since 2012.
[5] U.S. Credit Rating Downgraded – Gov Keeps Spending
In August 2011, Standard & Poor’s (“S&P”) downgraded the rating on U.S. credit. This is the first time in U.S. history that the United States government’s credit has ever been downgraded. The U.S. established an AAA credit rating in 1917.
In September 2012, Moody’s warns of downgrading U.S. credit rating – for the 5th time. Days later, credit rating agency Egan-Jones downgraded U.S. credit rating from AA to AA-.
The credit downgrades that occurred only under the Obama Administration had much to do with the ever-expanding U.S. debt, and continued FED stimulus programs (aka Economic Crack) that have been artificially propping up the U.S. economy for the last seven years. In 2011, the FED changed their accounting method to avoid the risk of showing losses on their multi-Trillion-Dollar balance sheet.
Upset about credit downgrades, the Obama Admin responded by having the DOJ sue S&P in 2013. By January 2015, S&P settled with the DOJ for $77 Million and was banned from participating in rating certain bonds for a year. There was a multi-state and DOJ second settlement for $1.35 Billion that same month. No credit agency has even dared to warn about U.S. credit risk since.
Beginning with the August 5, 2011 S&P downgrade of America’s credit rating, the U.S. National Debt has increased 30.28% to $4.416 Trillion. The total current U.S. debt under Barack Obama now stands at $8.42 Trillion or up 79% since Obama took office [Data Source: U.S. Treasury PDF, 53pps].
_____________________________________________________________________
Images by may be copyright by their respective owner.
Original article content, Copyright © 2016 NetAdvisor.org® All Rights Reserved.
NetAdvisor.org® is a non-profit organization providing public education and analysis primarily on the U.S. financial markets, personal finance and analysis with a transparent look into U.S. public policy. We also perform and report on financial investigations to help protect the public interest. Read More.
_____________________________________________________________________
