February 22, 2016
Census: Number of Americans in Poverty Highest Since 1959
original article written by Net Advisor™
WASHINGTON DC. Despite claims that the U.S. has been in economic recovery for the last 7 years, the U.S. government’s own data seems to tell a different story.
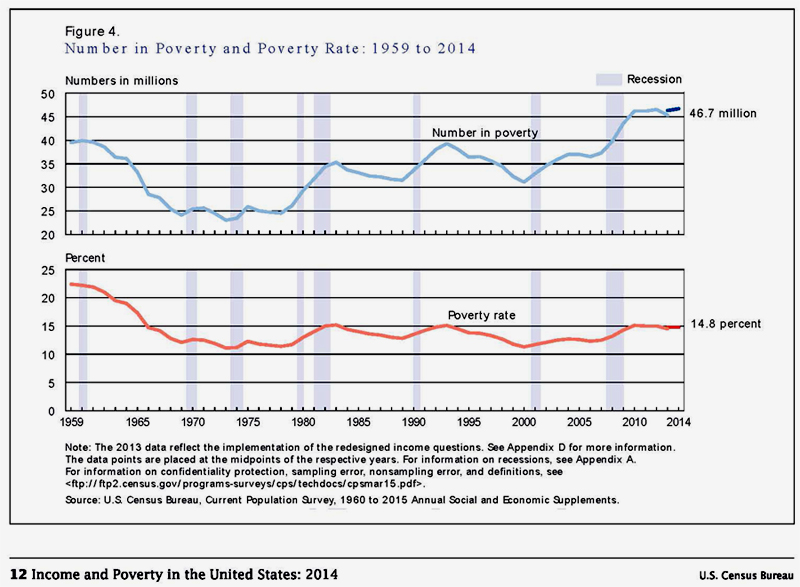
The U.S. Census Bureau released its 2014 poverty statistics in the U.S. showing that the number of Americans living in poverty is the highest since 1959 (chart above) Note: 2015 Census data will not be released until Sept 2016.
As a percentage of U.S. population, the U.S. poverty rate is 14.8%. U.S. poverty is worse under the Obama Administration than it was during the “Great Recession” under President Bush (chart above).
Blacks and Hispanics Hurt the Most Under Obama’s Democrat Leadership
Afro-Americans (26.2%) and Hispanics (23.6%) have suffered the highest poverty rates during the Obama Administration (p.21). These groups continue to vote Democrat which has only hurt their economic picture as Census data shows.
- Afro-Americans (ages 18-64) poverty rate was much lower at 19.4 to 20.6% under George W. Bush’s years – the highest poverty rate peaking in the 2008 recession (p.61).
- Hispanics (ages 18-64) poverty rate was also much lower at 17.7 to 19.3% under George W. Bush’s years – the highest poverty rate also peaking in the 2008 recession (p.61). Hispanics with children in the USA have 1 out of 3 (31.3%) living in poverty (p.63).
- Asian poverty (ages 18-64) is currently 10.8% but this has decreased from 12% in 2011. The highest poverty rate for Asians under Bush was 11.2% in 2003 and lowest 9.2% in 2002 (p.62).
- White alone (non-Hispanic) poverty rate (ages 18-64) is 10% – the highest poverty rate U.S. Census reported since 2002 (p.60).
U.S. Poverty in General:
This section highlights some of the key poverty statistics as reported by U.S. Census Bureau (p.21, table 3).
- U.S. Poverty Rate: 14.8%.
- Actual Number of Americans in Poverty: 46.7 Million.
- Poverty Rate for USA Children (under 18): 21.1% (or about 1 in 5).
- Poverty Rate for USA Adults (age 18-64): 13.5%.
- Poverty Rate for USA Adults (age 65+): 10%.
U.S. Poverty Rates by Nativity:
Census tracks nativity which are poverty rates based on where a person was born (p.21, table 3).
- All Native Born Americans: 14.2% in Poverty.
- All Foreign-Born Living in America: 18.5% in Poverty.
- All Non-U.S. Citizens Living in America: 24.2% in Poverty.
Single Families Have Higher Poverty Rates:
Married couples tend to have lower poverty rates. Census reported 6.2% of married couples lived in poverty. As the data shows, those not married with families tend to have more than double the poverty rate compared to those of married couples (p.64, table B-3).
- Male Household (no wife): 15.7% living below the poverty rate.
- Female Household (no husband): 30.6% living below the poverty rate (About 1:3).
U.S. Household Income:
U.S. Household income fell in 2014 and has remained 6.5% lower during the Obama Administration than it was under the Bush Administration.
- Medium Household Income fell $805 in 2014 from 2013 (p.6).
- Medium Household Income 6.5% LOWER Under Obama than Bush in 2007 (p.13).
Highlights:
“In 2014, the official poverty rate was 14.8 percent. There were 46.7 million people in poverty. Neither the poverty rate nor the number of people in poverty were statistically different from the 2013 estimates.
For the fourth consecutive year, the number of people in poverty at the national level was not statistically different from the previous year’s estimates.
The 2014 poverty rate was 2.3 percentage points higher than in 2007, the year before the most recent recession.
The 2014 poverty rates for most demographic groups examined were not statistically different from the 2013 rates. Poverty rates went up between 2013 and 2014 for only two groups: people with a bachelor’s degree or more, and married-couple families.”
— Source: U.S. Census Bureau (FY 2014)(PDF)(Full Report, 80pps, PDF). To locate cited pages faster, refer to PDF page numbers and not original page number.
Summary
It seems very hard to argue that the U.S. economy is in “recovery” when the government’s own data says otherwise. Incomes are down over 7 years. Despite trillions of welfare spending, more people are living in poverty since 1959. Clearly Obama’s campaign of “Hope and Change” and “Yes We Can (Video)” and “Change We Can Believe In” has not worked over 7 years.
Many have loosely claimed that the definition of insanity is, doing the same thing over and over again and expecting a different result.
What is amazing is there are people who follow presidential contenders Hillary Clinton, Bernie Sanders and Democrats in general who think that more of the same will solve America’s problems?
Data Content: U.S. Census Bureau.
Original article content, copyright © 2016 NetAdvisor.org® All Rights Reserved.
NetAdvisor.org® is a non-profit organization providing public education and analysis primarily on the U.S. financial markets, personal finance and analysis with a transparent look into U.S. public policy. We also perform and report on financial investigations to help protect the public interest. Read More.