June 16, 2014
Average Unemployment Rate Higher Under Obama
original article written by Net Advisor™
WASHINGTON DC. We did an analysis of the last 13 years and compared the U.S. official unemployment rates.
During this period, some have touted dire times during President Bush’s “two recessions,” which there were issues. Then we have the other side touting the alleged success of President Obama’s “economic recovery.” There is much political grandstanding here, so we checked the official U.S. Bureau of Labor Statistics’ history of the unemployment numbers to see what are the facts.
Unemployment Data
To date this is the official government data:
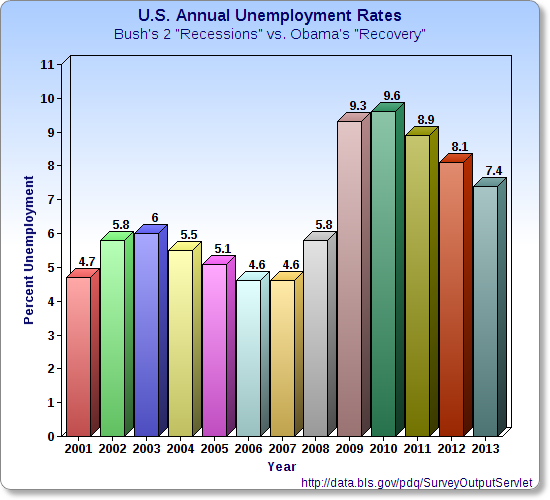
BUSH’S TWO “RECESSIONS”
- 2001 Unemployment Rate 4.7% “9/11 & Dot Com Recession.” [1]
- 2002 Unemployment Rate 5.8% Recession.
- 2003 Unemployment Rate 6.0% Highest unemployment under Bush.
- 2004 Unemployment Rate 5.5% Housing market booming.
- 2005 Unemployment Rate 5.1% Housing market booming. [2]
- 2006 Unemployment Rate 4.6% Lowest unemployment under Bush. [3]
- 2007 Unemployment Rate 4.7% “Recession.” [4]
- 2008 Unemployment Rate 5.8% “The Great Recession” (Stock Market & Housing Crash).
OBAMA’S “RECOVERY”
- 2009 Unemployment Rate 9.3% “Recession is Over.” [5]
- 2010 Unemployment Rate 9.6% “Recovery” Highest unemployment under Obama. [6]
- 2011 Unemployment Rate 8.9% “Recovery.” [7]
- 2012 Unemployment Rate 8.1% “Recovery.” [8]
- 2013 Unemployment Rate 7.4% “Recovery.”
- 2014 Unemployment Rate 6.3% (as of May) Lowest unemployment under Obama. [9]
— Unemployment Data Source: BLS.gov (PDF)
Obama’s Unemployment Rate Worse Than Bush
So far, President Obama’s lowest unemployment rate is still higher than the highest unemployment rate under Bush. This is likely to change either by government number manipulation or hopefully resurrecting growth in the economy.
Based on my economic studies, research and writing about jobs, the deficit and the economy, my prediction is unless policies change to be more friendly toward growth, then the probability is that the economy will meander or decline.
ZERO Net New Jobs – Obama’s First Three Years
In 2012 our report based on CNN and BLS.gov data found that more people lost jobs than gained jobs during Obama’s first 3 years in office.
Data
I have repeatedly argued since 2010 that the U.S. jobs data is being manipulated. Even if we use the official (manipulated) numbers, the U.S. economic “recovery” under President Obama is worse than the two recessions that occurred under President Bush’s tenure. President Obama has about 3 1/2 years to see what he might do to improve the economic picture during his tenure, but this is where we are after Obama’s first 5 years in office.
The Truth Behind the Unemployment Numbers
The true unemployment numbers are likely to go down in the meantime; not because of natural economic growth, but because the way the Obama Administration calculates unemployment.
A big part why the unemployment rate is falling under President Obama is because more people are dropping out of the labor force, called the Labor Participation Rate. As people give up looking for work even during a 30-day period, the BLS does not count them as being unemployed. The result of this government calculation creates the illusion that the unemployment rate is going down when other government data suggests the U.S. unemployment is actually soaring.
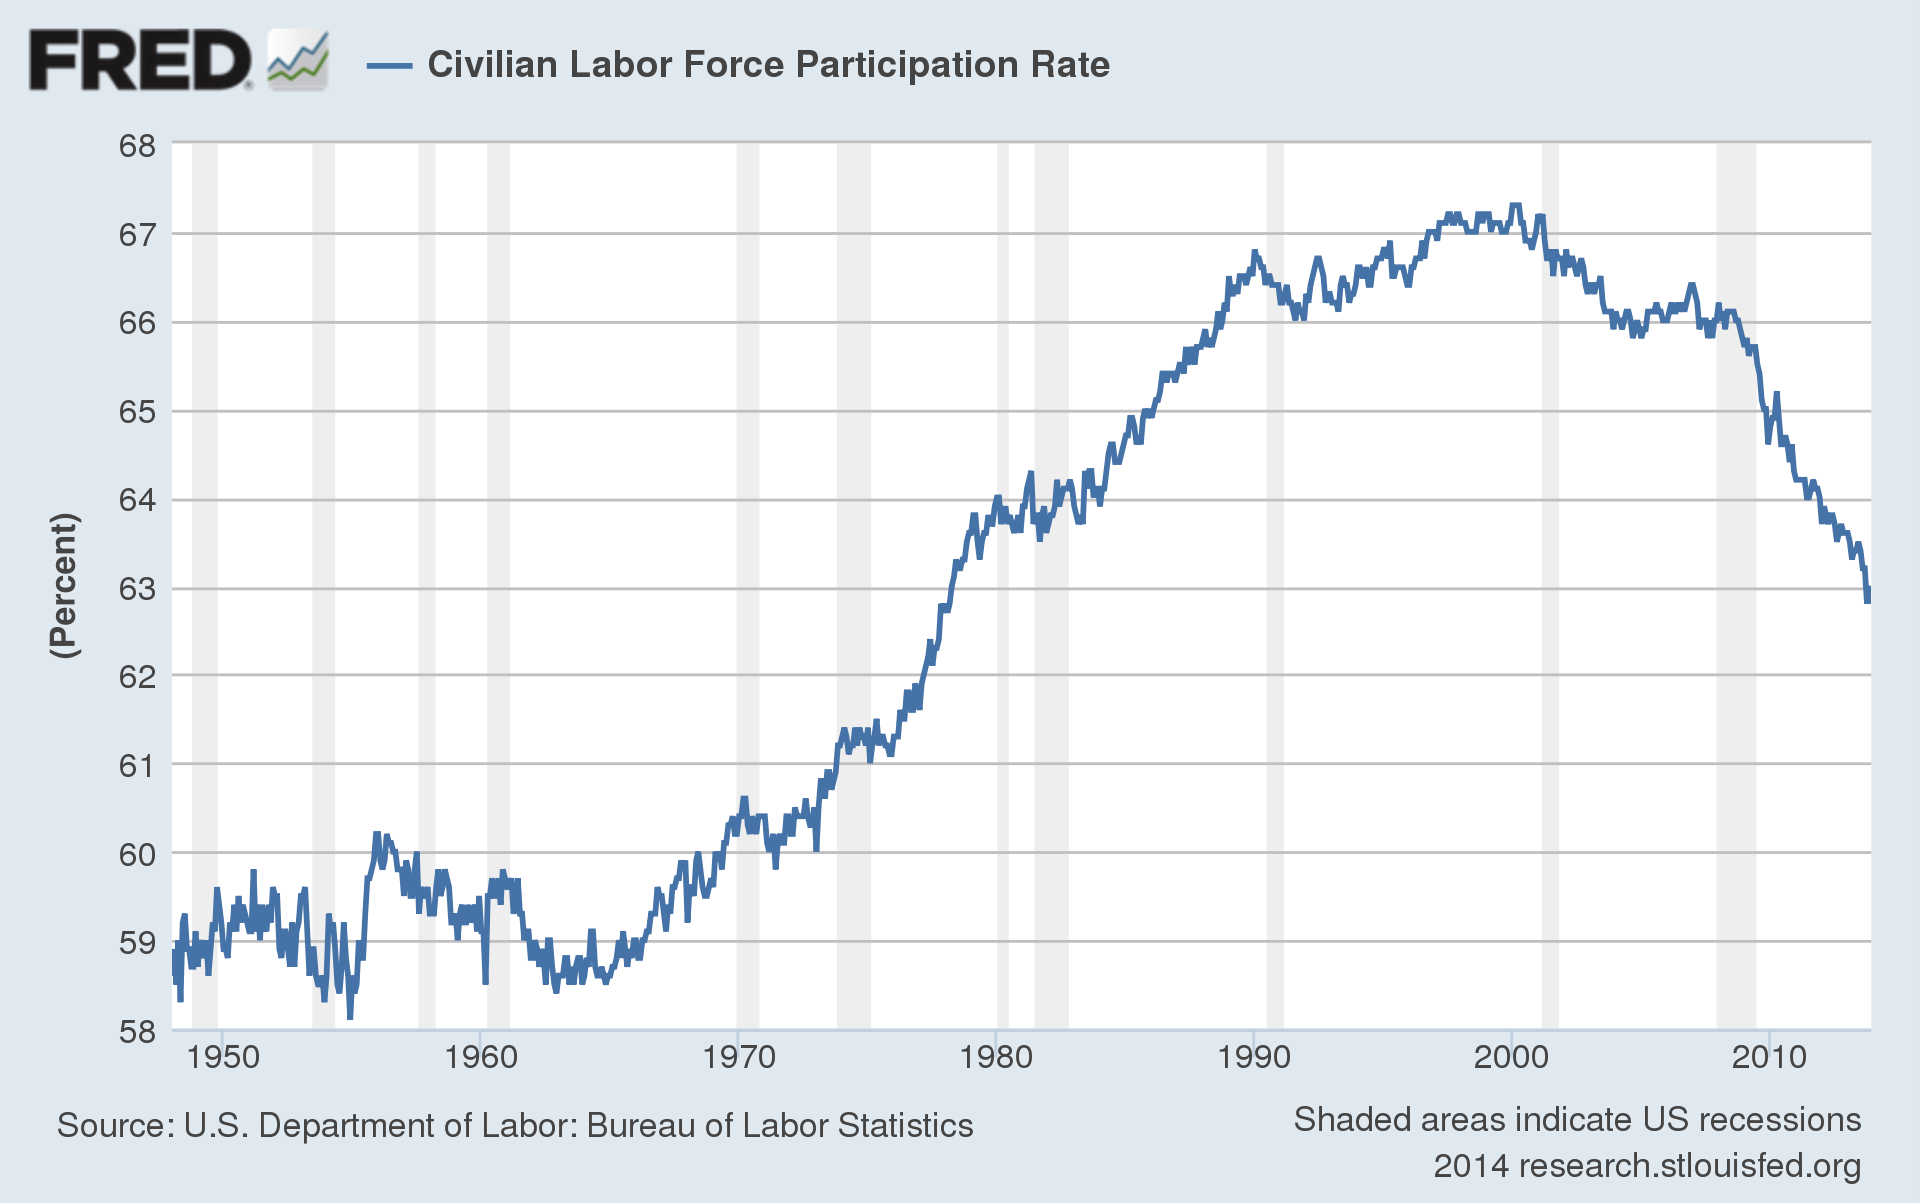
Meet “FRED”
The St. Louis Federal Reserve Economic Data or “FRED” chart above shows that people have been dropping out of the labor force since around the year 2000 (unofficial recession date).
The Labor Participation Rate then began to stabilize in the mid 2000’s. By 2007-2009, the housing-credit bubble bust drove more people out of the work force, which is expected for a recession. But what is a bit disconcerting, the Obama administration has made all sorts of unsubstantiated claims including that the U.S. has been in ‘economic recovery’ since about February 2009.
During the Obama Administration’s watch, the number of people who have dropped out of the labor force has plunged faster than at any time in recorded history, currently over 92 million people (“FRED” Graphic). As of January 2014, the number of people not in the labor force (not working) is at a 35 year low.
Many Job Gains Are Low-Skill, Low-Wage
There are job gains in the economy, but many of the gains are low wage, unskilled jobs.
Food and drinking places is one of the largest growth areas in the economy. In the latest jobs report, the U.S. is averaging 28,000 food and drinking jobs per month. So more people are eating more and drinking more, and with 92 million not working, are we surprised?
Redefining an Industry
The government also changed the definition of what a manufacturing job is. Food processing plants, such as packaged foods are now considered to be counted as a manufacturing job. Thus the Obama Administration sees no difference between someone who makes potato-chips or Twinkies, verses someone who builds cars or airplanes.
What We Have Learned
So now we know that there were more people working in the Bush “recessions” than people working so far in the Obama “recovery.” We know that the worst year for unemployment under Bush is still better than the best year of unemployment under Obama.
The Obama Administration is changing its methodology for employment and revising the definition of an entire industry. We have also learned that despite all these manipulations to the employment data, more people are falling out of the workforce at a rate faster under President Obama than at any time in U. S. history.
I predict that the U.S. economy is at risk of another technical recession (two consecutive quarters of negative GDP growth), however I have argued that the U.S. recession is not over (by layman standards), and the FED data seems to support this.
Notes:
[1] “9/11” terrorist’ attacks 2,996 fatalities, dot com bust began March 2000 (NASDAQ peaked), Afghanistan 2001.
[2] Hurricane Katrina – Costliest natural disaster (1,833 fatalities, $108 Billion damage).
[3] Housing Market Peaks.
[4] Bear Sterns Sub-prime Fund Busts. Housing Market Final Red Flag before the big crash (was my view).
[5] Obama Stimulus, Obamacare passed (effective 2010). (D) Control 100% gov.
[6] Unemployment climbs in 2nd year when (D) Control 100% gov. (R) Sweep the House in Nov., biggest shift in power since 1928.
[7] S&P Downgrades U.S. Debt rating, 1st time in U.S. history.
[8] If the economy is improving, why is the FED printing $85 Billion per month trying to stimulate it?
[9] Supposedly still in economic “Recovery.”
Original article content, Copyright © 2014 NetAdvisor.org® All Rights Reserved.
NetAdvisor.org® is a non-profit organization providing public education and analysis primarily on the U.S. financial markets, personal finance and analysis with a transparent look into U.S. public policy. We also perform and report on financial investigations to help protect the public interest. Read More.
