10.07.2010

Market Report
Investor Education Series: Volume I. Issue 3
Original article written by Net Advisor™
Stocks have headed higher despite the fact that the 2009 Obama $787 Billion Stimulus and subsequent stimulus programs have not produced greater wealth or jobs in the United States. Stock market trading volume has suggested over the last year that mom and pop investors have been pretty much been sitting out the market after being whacked for 2 years during the housing-credit crash of 2007-2009. So why is the market going higher?
1. Cash
Money managers have been sitting on large cash holdings. Lots of cash and little to do with it, managers seeking to buy where they see performance or value.
2. Short Covering
Bearish bets, those believing that the economic recovery is not here and holding short positions have been squeezed by those buying stocks pushing them artificially higher.
3. Managers Chasing Performance
The stock market had been generally flat for most of 2010. This does not bode well for fund managers who make their keep by demonstrating performance in their funds. Solution? Just buy and cross your fingers, and hope that everyone else follows. It has worked for the most – so far. This was a similar strategy that was used in the fourth quarter of 2009.
Many fund managers are paid either directly or in large part by performance from their fund. They also often have benchmarks to beat. Thus, if their performance is not exactly rushing you to buy that new car or home, they will take cash and flood the market with buy orders to try and prop up stocks. This can work in the short run, and coupled with low interest rates, stocks can move higher.
4. Low Interest Rates
The FED has kept interest rates low which does several things.
(1) It helps consumers with various debt including mortgage payments refinance their loans (if they can) at record low rates, making the loans more affordable.
(2) This also allows corporations to refinance their debt at record low interest rates, which can save money, thus increase their profits for stockholders. Corporations can also use this savings for expanding their business including employing new workers. This doesn’t mean a company will hire people right away, but they will have a better position to hire people in the future when such demand for products and services increase.
Separately, the Bank of Japan (BOJ) recently enacted a surprise interest rate cut (story link gone) to near zero percent. By doing this it makes exports more affordable to other countries such as when U.S. consumers buy Japanese made products for example, vehicles and electronics. The problem is, lowering these rates devalues the Yen (Japanese currency) making imports more expensive to Japanese consumers.
It is expected the U.S.’s Federal Reserve Bank (The FED) is going to do something similar where by devaluing the U.S. dollar will make U.S. exports more affordable to overseas consumers, thus helping to boost stock prices for companies selling goods outside the USA. It also can increase demand for U.S. products which can help for more American jobs. The FED is making this move perhaps and arguable coaxed by the Obama Administration since Americans are overwhelmingly opposed to more government stimulus spending (Source: Politco). Because we are close to the November mid-term election the idea is, get the FED do it.
The FED is likely to purchase more Treasury securities which will in effect drive down interest rates, and hopefully increase economic activity (Source: NY Times).
The FED stopped doing this back in March 2010, and the economy has been moving slowing ever since. This is all artificial stimulus and cannot be sustained over a long period of time.
This new stimulus idea has been largely called “QE2” for “Quantitative Easing #2;” or in English, “dump more money into the economy to try and get this economic train move faster, there’s an election coming up and another one starts a year from now.” This risk to lowering interest rates from near zero to zero is that when the economy turns, we could see interest rates rise quickly and sharply. Those holding longer term U.S. Treasury Notes, Treasury Bonds or corporate bonds or bond funds could end up losing money or have negative returns after factoring in inflation and taxes.
The solution for dealing with future inflation so far is gold (Gold ETF: GLD), and alternatively, not as widely talked about yet, Treasury Inflation Protected Securities or TIPS.
“Treasury Inflation-Protected Securities, or TIPS, provide protection against inflation. The principal of a TIPS increases with inflation and decreases with deflation, as measured by the Consumer Price Index. When a TIPS matures, you are paid the adjusted principal or original principal, whichever is greater.
TIPS pay interest twice a year, at a fixed rate. The rate is applied to the adjusted principal; so, like the principal, interest payments rise with inflation and fall with deflation.”
— Source: Treasury Direct.gov
The International Monetary Fund (IMF) chief Dominique Strauss-Kahn cited his concern of an effective trade war of who can devalue their currency the most, thus driving down export costs to be more competitive overseas. Again, this does not help domestic consumers in the host country whose currency is be devaluated.
“There is clearly the idea beginning to circulate that currencies can be used as a policy weapon. Translated into action, such an idea would represent a very serious risk to the global recovery … Any such approach would have a negative and very damaging longer-run impact.”
— IMF Chief Dominique Strauss-Kahn (Source: Telegraph.UK)
Like the devaluation of the Yen, as the U.S. Dollar is subject to FED devaluation, the effect also makes imported goods more expensive to U.S. consumers. The result of this can increase the chances of inflation in the future.
A lower U.S. dollar also impacts commodity prices such as gold, silver, copper (used in buildings, homes, computers/ electronics, hybrid-green cars, etc), and oil (heating oil and gasoline). The result of a lower dollar tends to increase prices in these areas for consumers.
[wikichart align=”right” ticker=”gld” showannotations=”true” livequote=”true” startdate=”01-01-2010″ enddate=”07-10-2010″ width=”390″ height=”245″]
[wikichart align=”right” ticker=”slv” showannotations=”true” livequote=”true” startdate=”01-04-2010″ enddate=”07-10-2010″ width=”390″ height=”245″]
[wikichart align=”right” ticker=”uso” showannotations=”true” livequote=”true” startdate=”01-01-2010″ enddate=”07-10-2010″ width=”390″ height=”245″]
Gold, silver (ETF: SLV) and copper all have hit recent record highs (not adjusted for inflation) (Source: MarketWatch). Oil (ETF: USO) prices have also been moving higher which consumers can expect to be paying more for heating oil this winder and gasoline at the pump.
5. Corporations Cutting Costs and Jobs
Since many corporations are not making money hand over fist, except perhaps Apple and a handful of others, the way to drive a stock price higher is to lay people off, and cut other costs. Laying people off is the biggest savings for a business, but sometimes it’s necessary in order for the business to stay alive and continue in the future. If a company has good prospects for demand in the future, they can always hire people back.
If on the other hand a company keeps too many people employed and at high costs especially when there are decreasing sales, one ends up like a General Motors or Chrysler did in 2009 – bankrupt.
The other way that company’s can increase their bottom line is by increasing prices. However raising prices in a recession may not be the best strategy if consumers don’t need a product or service, or if there are alternative ways to substitute for that product or service.
6. The Economy & The 2010 Mid-Term Election
The stock market has also been climbing on the momentum that there will be a big change come November. The public generally has not been pleased at the rate of U.S. debt spending, plus no results from the stimulus, and no material change in jobs as the Obama Administration has promised 2 years ago. On top of that, the prospects for higher taxes for everyone in 2011 (not just the “rich”), and the new higher costs in government mandated ObamaCare has moved more voters in most states toward conservatives and tea party candidates, and the stock market has reflected this action.
“There is a good chance that the strength we have seen in the market recently is due partly to an expectation about the result of the election,” says Jason Trennert, chief strategist at Strategas. “Investors are starting to understand that a likely result of this election is gridlock, and that is good.”
— Source: Wall Street Journal
The latest Rasmussen poll (10-06-2010) says 32% of Americans feel that the economy is headed in the right direction. The poll also shows 61% of Americans feel the economy is headed in the wrong direction.
A separate poll published October 6, 2010 said, “53% of adults feel the federal government has too much influence over the economy already, while only 20% say it doesn’t have enough influence. ”
Also, the unemployment rate has not had much improvement from a year ago even if you use the governments own numbers. In August 2009, the unemployment rate was 9.7% and a year later it is 9.6% (Chart below).
Chart: U.S. Unemployment Rate (official)
| Year | Jan | Feb | Mar | Apr | May | Jun | Jul | Aug | Sep | Oct | Nov | Dec | Annual |
|---|---|---|---|---|---|---|---|---|---|---|---|---|---|
| 2000 | 4.0 | 4.1 | 4.0 | 3.8 | 4.0 | 4.0 | 4.0 | 4.1 | 3.9 | 3.9 | 3.9 | 3.9 | |
| 2001 | 4.2 | 4.2 | 4.3 | 4.4 | 4.3 | 4.5 | 4.6 | 4.9 | 5.0 | 5.3 | 5.5 | 5.7 | |
| 2002 | 5.7 | 5.7 | 5.7 | 5.9 | 5.8 | 5.8 | 5.8 | 5.7 | 5.7 | 5.7 | 5.9 | 6.0 | |
| 2003 | 5.8 | 5.9 | 5.9 | 6.0 | 6.1 | 6.3 | 6.2 | 6.1 | 6.1 | 6.0 | 5.8 | 5.7 | |
| 2004 | 5.7 | 5.6 | 5.8 | 5.6 | 5.6 | 5.6 | 5.5 | 5.4 | 5.4 | 5.5 | 5.4 | 5.4 | |
| 2005 | 5.3 | 5.4 | 5.2 | 5.2 | 5.1 | 5.0 | 5.0 | 4.9 | 5.0 | 5.0 | 5.0 | 4.9 | |
| 2006 | 4.7 | 4.8 | 4.7 | 4.7 | 4.6 | 4.6 | 4.7 | 4.7 | 4.5 | 4.4 | 4.5 | 4.4 | |
| 2007 | 4.6 | 4.5 | 4.4 | 4.5 | 4.4 | 4.6 | 4.6 | 4.6 | 4.7 | 4.7 | 4.7 | 5.0 | |
| 2008 | 5.0 | 4.8 | 5.1 | 5.0 | 5.4 | 5.5 | 5.8 | 6.1 | 6.2 | 6.6 | 6.9 | 7.4 | |
| 2009 | 7.7 | 8.2 | 8.6 | 8.9 | 9.4 | 9.5 | 9.4 | 9.7 | 9.8 | 10.1 | 10.0 | 10.0 | |
| 2010 | 9.7 | 9.7 | 9.7 | 9.9 | 9.7 | 9.5 | 9.5 | 9.6 |
Chart Above: Source: U.S. Bureau of Labor Statistics (View: HTML or PDF).
I have argued (Feb 2010 article, June 2010 article) that the actual unemployment rate is much higher as the government does not count all unemployed workers in its data under certain circumstances. Back in March 2010, the government blamed “the weather” for the poor jobs numbers that month. In that same period, despite “the weather,” government managed to add 48,000 temporary census workers all over the country.
Typically what happens in an election year, the party in power tends to lose power if the economy is poor, or if general sentiment is negative. This has tended to occur throughout history. The last time it occurred was the 2008 election, and it is likely to take place in 2010.
“When the social mood is pessimistic, the market is low and people tend to vote out the incumbent and put a new party in power.”
— John Nofsinger, Ph.D. (Journal of Socio-Economics, 2007) quote from Investopedia
Based on facing the lack of success at deficit spending, stimulus programs, and the continued slow economy and job concerns, President Obama has resorted to campaigning to try and keep his party in power (Source: Bloomberg).
7. Historical Trends
Mid-term elections have tended to be positive for the stock market. The Dow and S&P 500 have only had 3 losing Novembers in the last 15 Mid-Term elections (Source: Stock Trader’s Almanac 2010, Hirsch, P100).
The stock market had a big run in September, the largest one month run since 1939 (Source: Wall Street Journal). This move however was on the back of a poor performance for August when the Dow fell 4.3%, the S&P fell 4.7% and NASDAQ dropped 6.2%. Virtually if not most all the August data suggested anything but economic prosperity (Source: NY Times). Most people could cite the historical trends that suggests September is the worst month for stocks of the year. One only has to go back to September 2008 to remember that. However this time, the market made an all-time one-month record for a September.
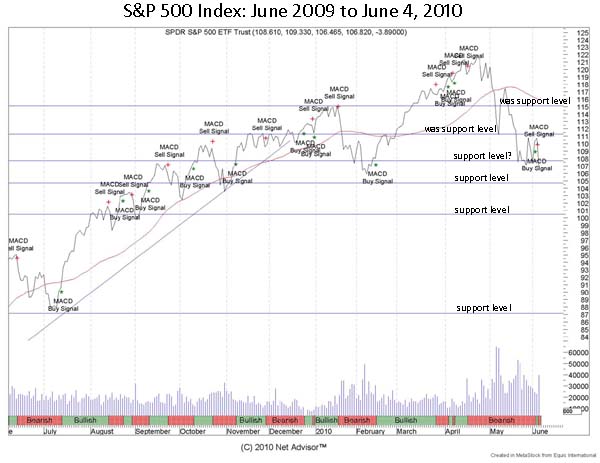
8. Charting the Market
(Please refer to big chart, top of this page). Stocks went down a bit lower as the trend suggested last June and bounced off 1020 on the S&P 500 (S&P 500 Fact Sheet in PDF, HTML Link). Note the big chart shows the S&P 500 under ETF Symbol: SPY, add a zero to the last number to reach about what the underline index should show (example follows).
If the S&P 500 closed below 1025 (chart: 102), for say several days in a row, the next support level in the S&P was about 980 (chart: 98) (not shown). The S&P hit a high of about 1130 (chart: 113) in early August and a low of about 1055 (chart: 105). After testing support level in late August, the market ran virtually straight up in September.
There was a late and recent sell signal in the S&P 500, however it is really hard to confirm this at this point. The market may have moved ahead itself, and has largely been ignoring the true economic data (again) and instead, may be moving on “QE2” prospects. Add a change in control of the House and the Senate, the market believes that political gridlock may be the best move for the economy right now. We could see a pullback or “sell on the news” come the November election, then perhaps a Santa Claus Rally come year end.
9. Future Concerns
There are many concerns for the economy where I began citing since 2007 including here and here. The IMF cited concerns on October 5, 2010 that U.S. and EU banks may still need to recapitalize as they face $4 Trillion in debt refinancing over the next 2 years (Source: Telegraph.UK). There really is a laundry list that could be added here. But for now, the market is up.
Short link: https://www.netadvisor.org/?p=5247
Copyright © 2010 Net Advisor™ All Rights Reserved.
NetAdvisor.org® is a non-profit organization providing public education and analysis primarily on the U.S. financial markets, personal finance and analysis with a transparent look into U.S. public policy. We also perform and report on financial investigations to help protect the public interest. Read More.
